 TerraWeb
TerraWeb
Earth in Motion, Knowledge in Action.
Earth's Systems
Atmosphere
Hydrosphere

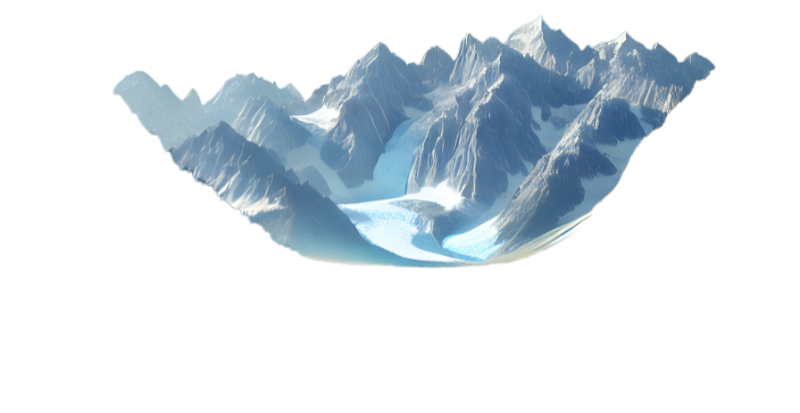
Cryosphere
Geosphere
Biosphere
Atmosphere
The thin layer made up of a mixture of gases and particles suspended in the air that surround the Earth (78% N2, 21% oxygen, 0.9% argon, and 0.1% other gases).
There are five main layers that make up the atmosphere:
-
1. Troposphere: The lowest layer where weather occurs and where we live. It contains about 75% of the atmosphere’s mass.
-
3. Stratosphere: Contains the ozone layer, which absorbs and scatters ultraviolet solar radiation.
-
3. Mesosphere: The layer where most meteors burn up upon entering the atmosphere.
-
4. Thermosphere: A layer with very thin air, where the auroras occur and the International Space Station orbits.
-
5. Exosphere: The outermost layer, where the atmosphere thins out into space.
Source:
 https://www.nasa.gov/general/what-is-earths-atmosphere
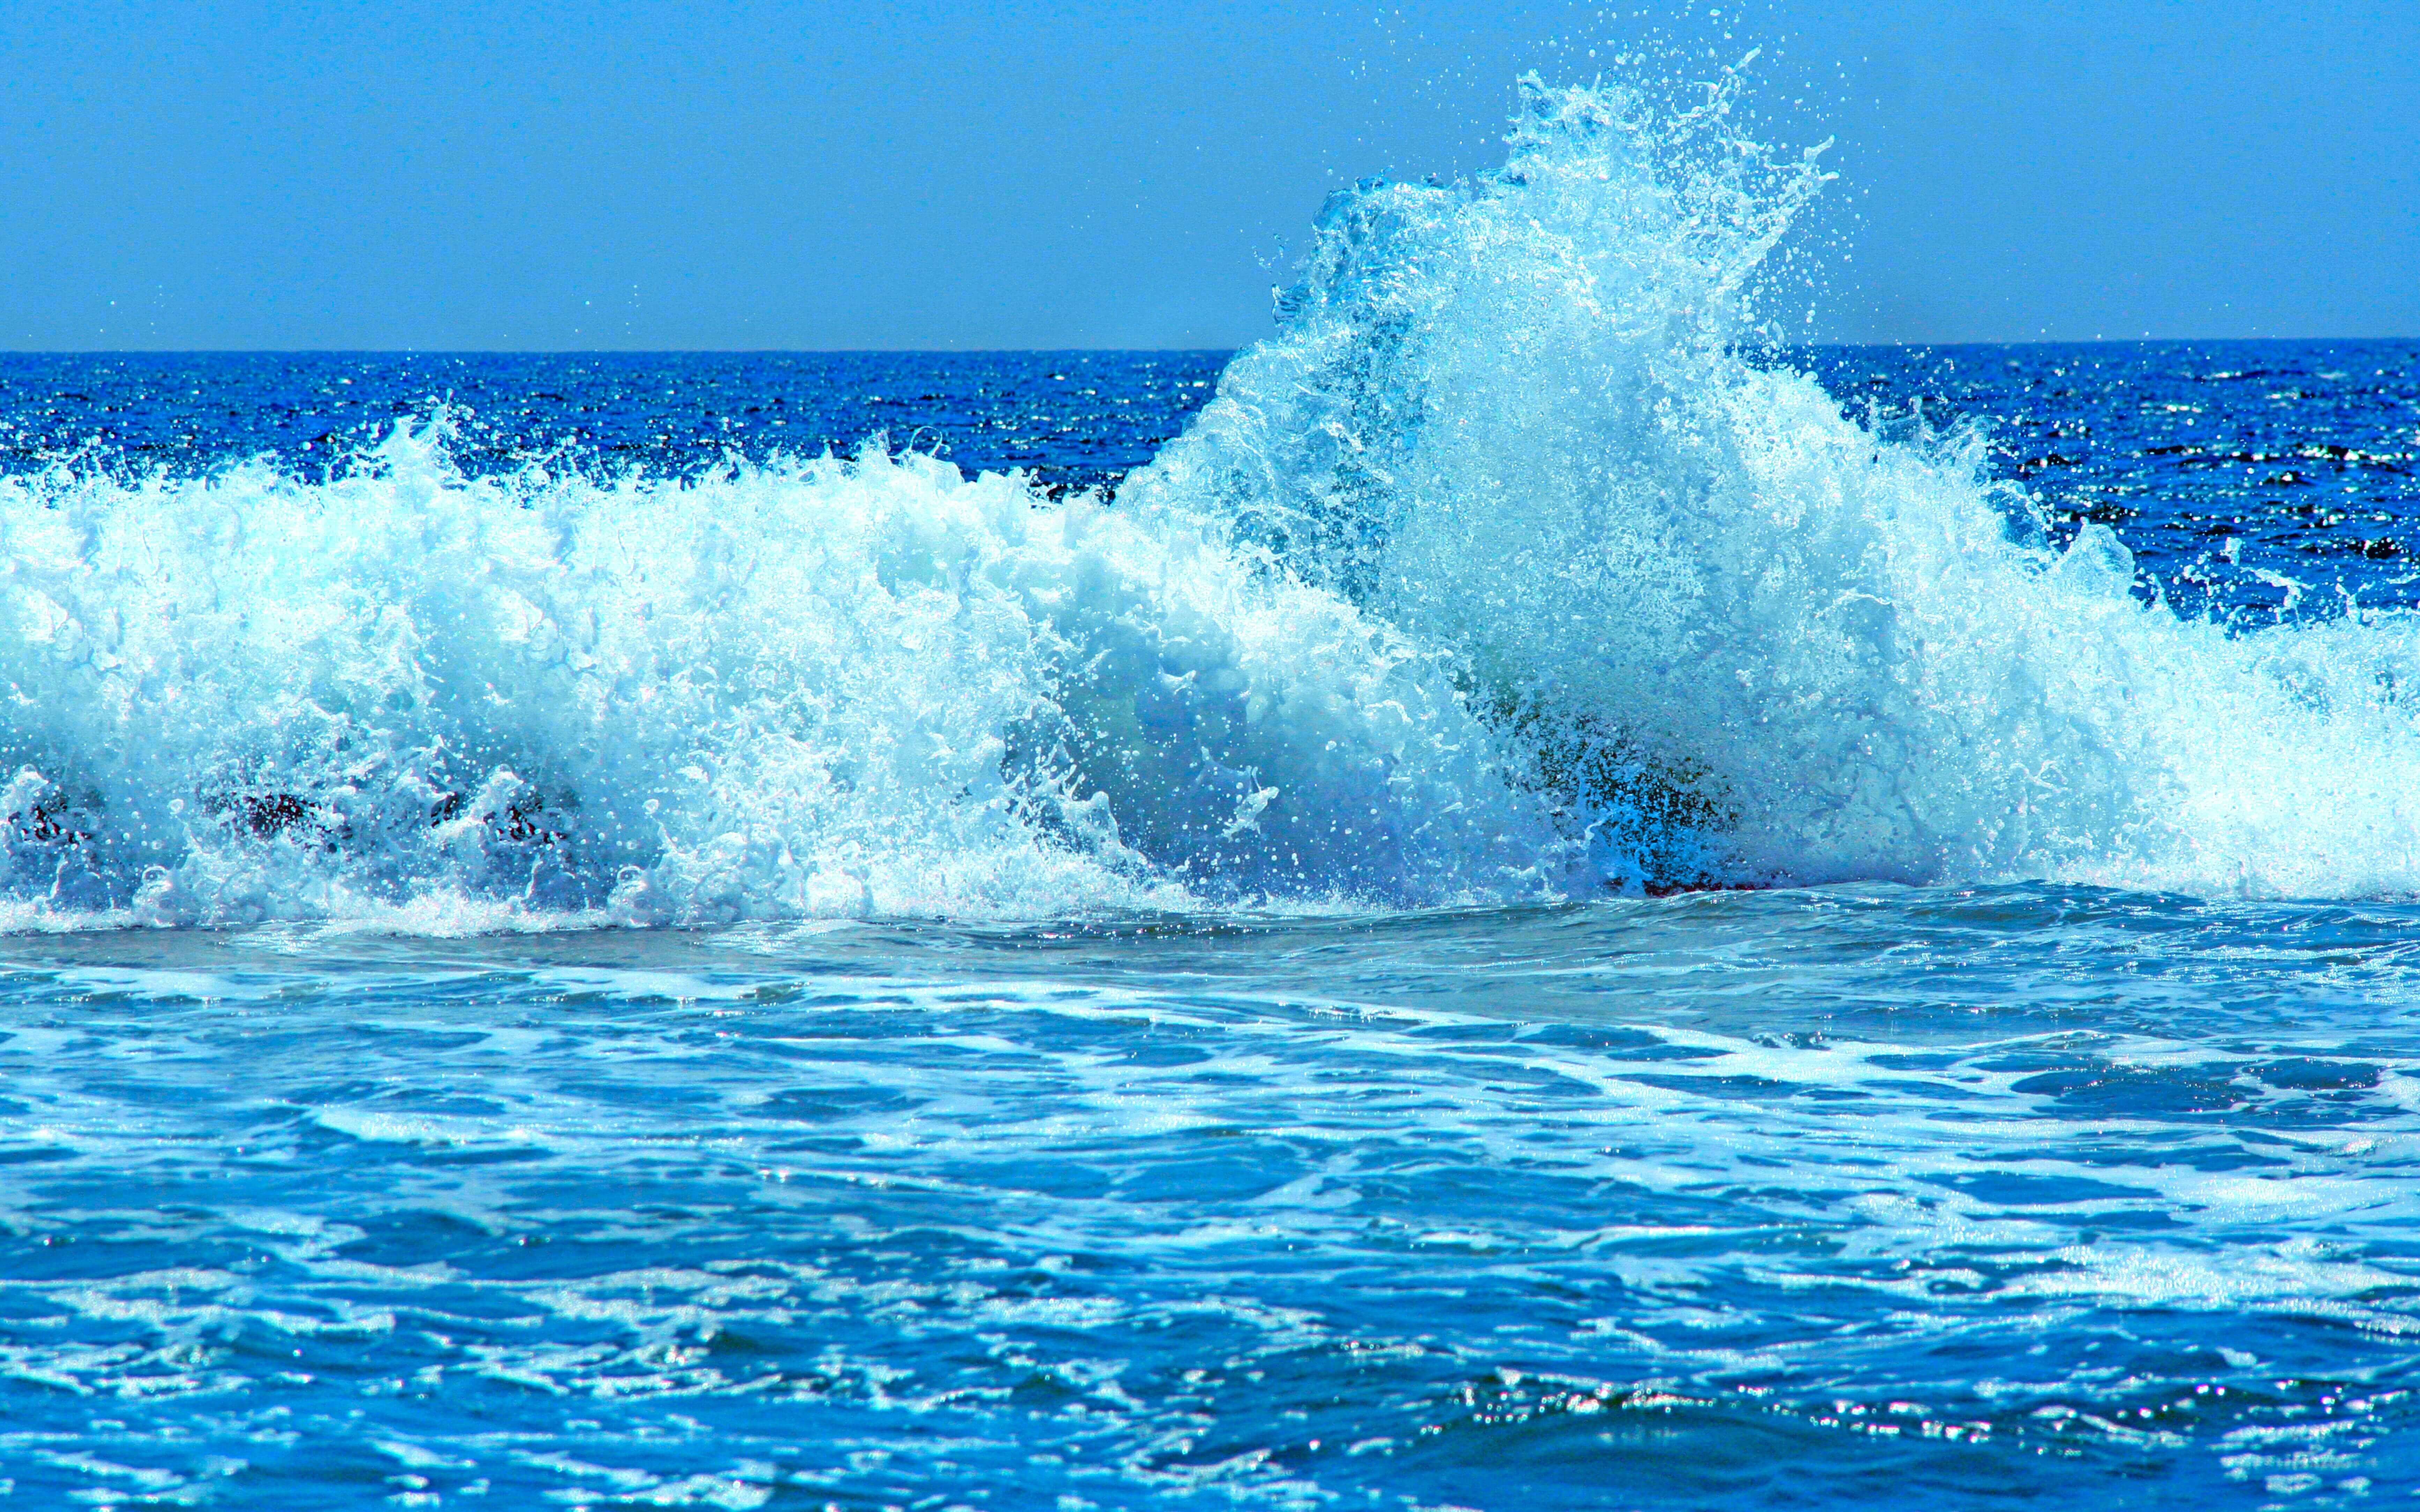
Hydrosphere
A sphere that includes the liquid ocean, inland water bodies and groundwater.
Hydrosphere covers 70% of the Earth’s surface.
Hydrosphere is necessary for sustaining life on Earth.
The Hydrosphere is a crucial part for the Water Cycle, includes processes like evaporation, condensation, precipitation etc.
Oceans absorb and store solar energy, distribute heat around the globe through currents and influence weather patterns.
Source:
https://mynasadata.larc.nasa.gov/basic-page/about-hydrosphere
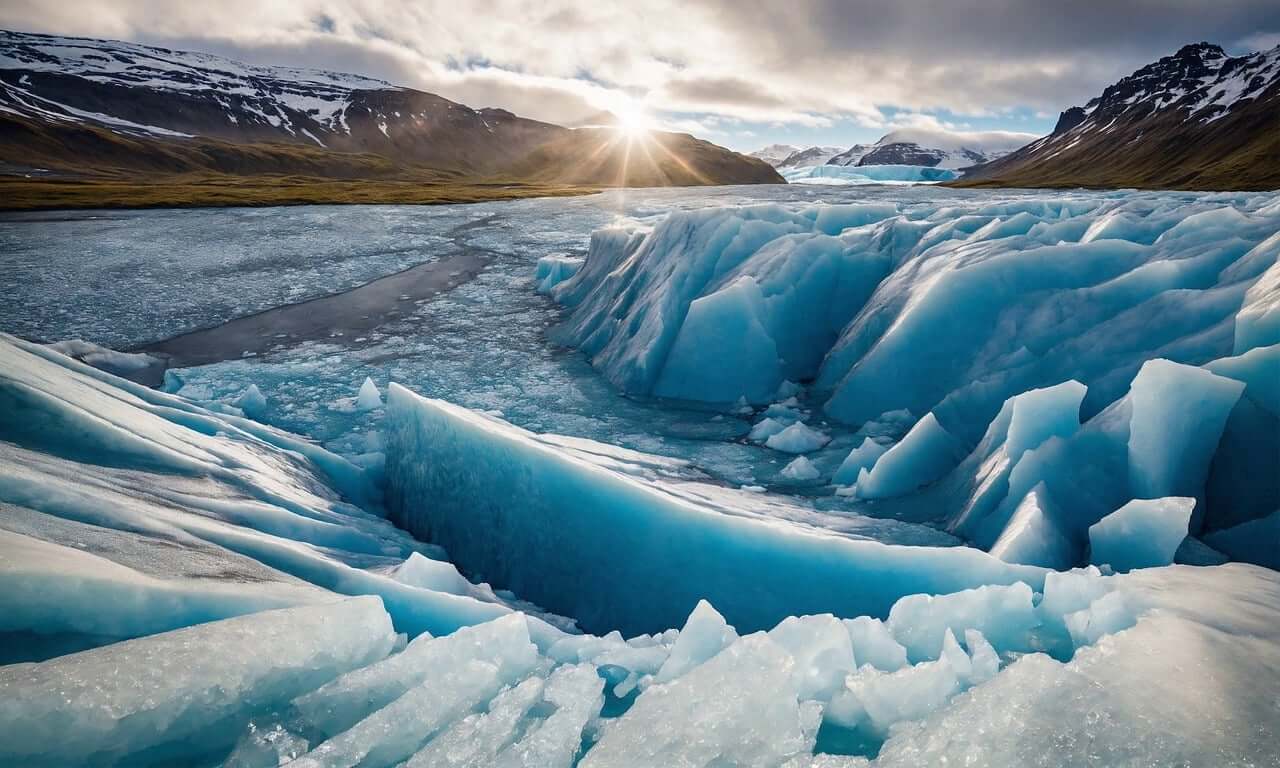
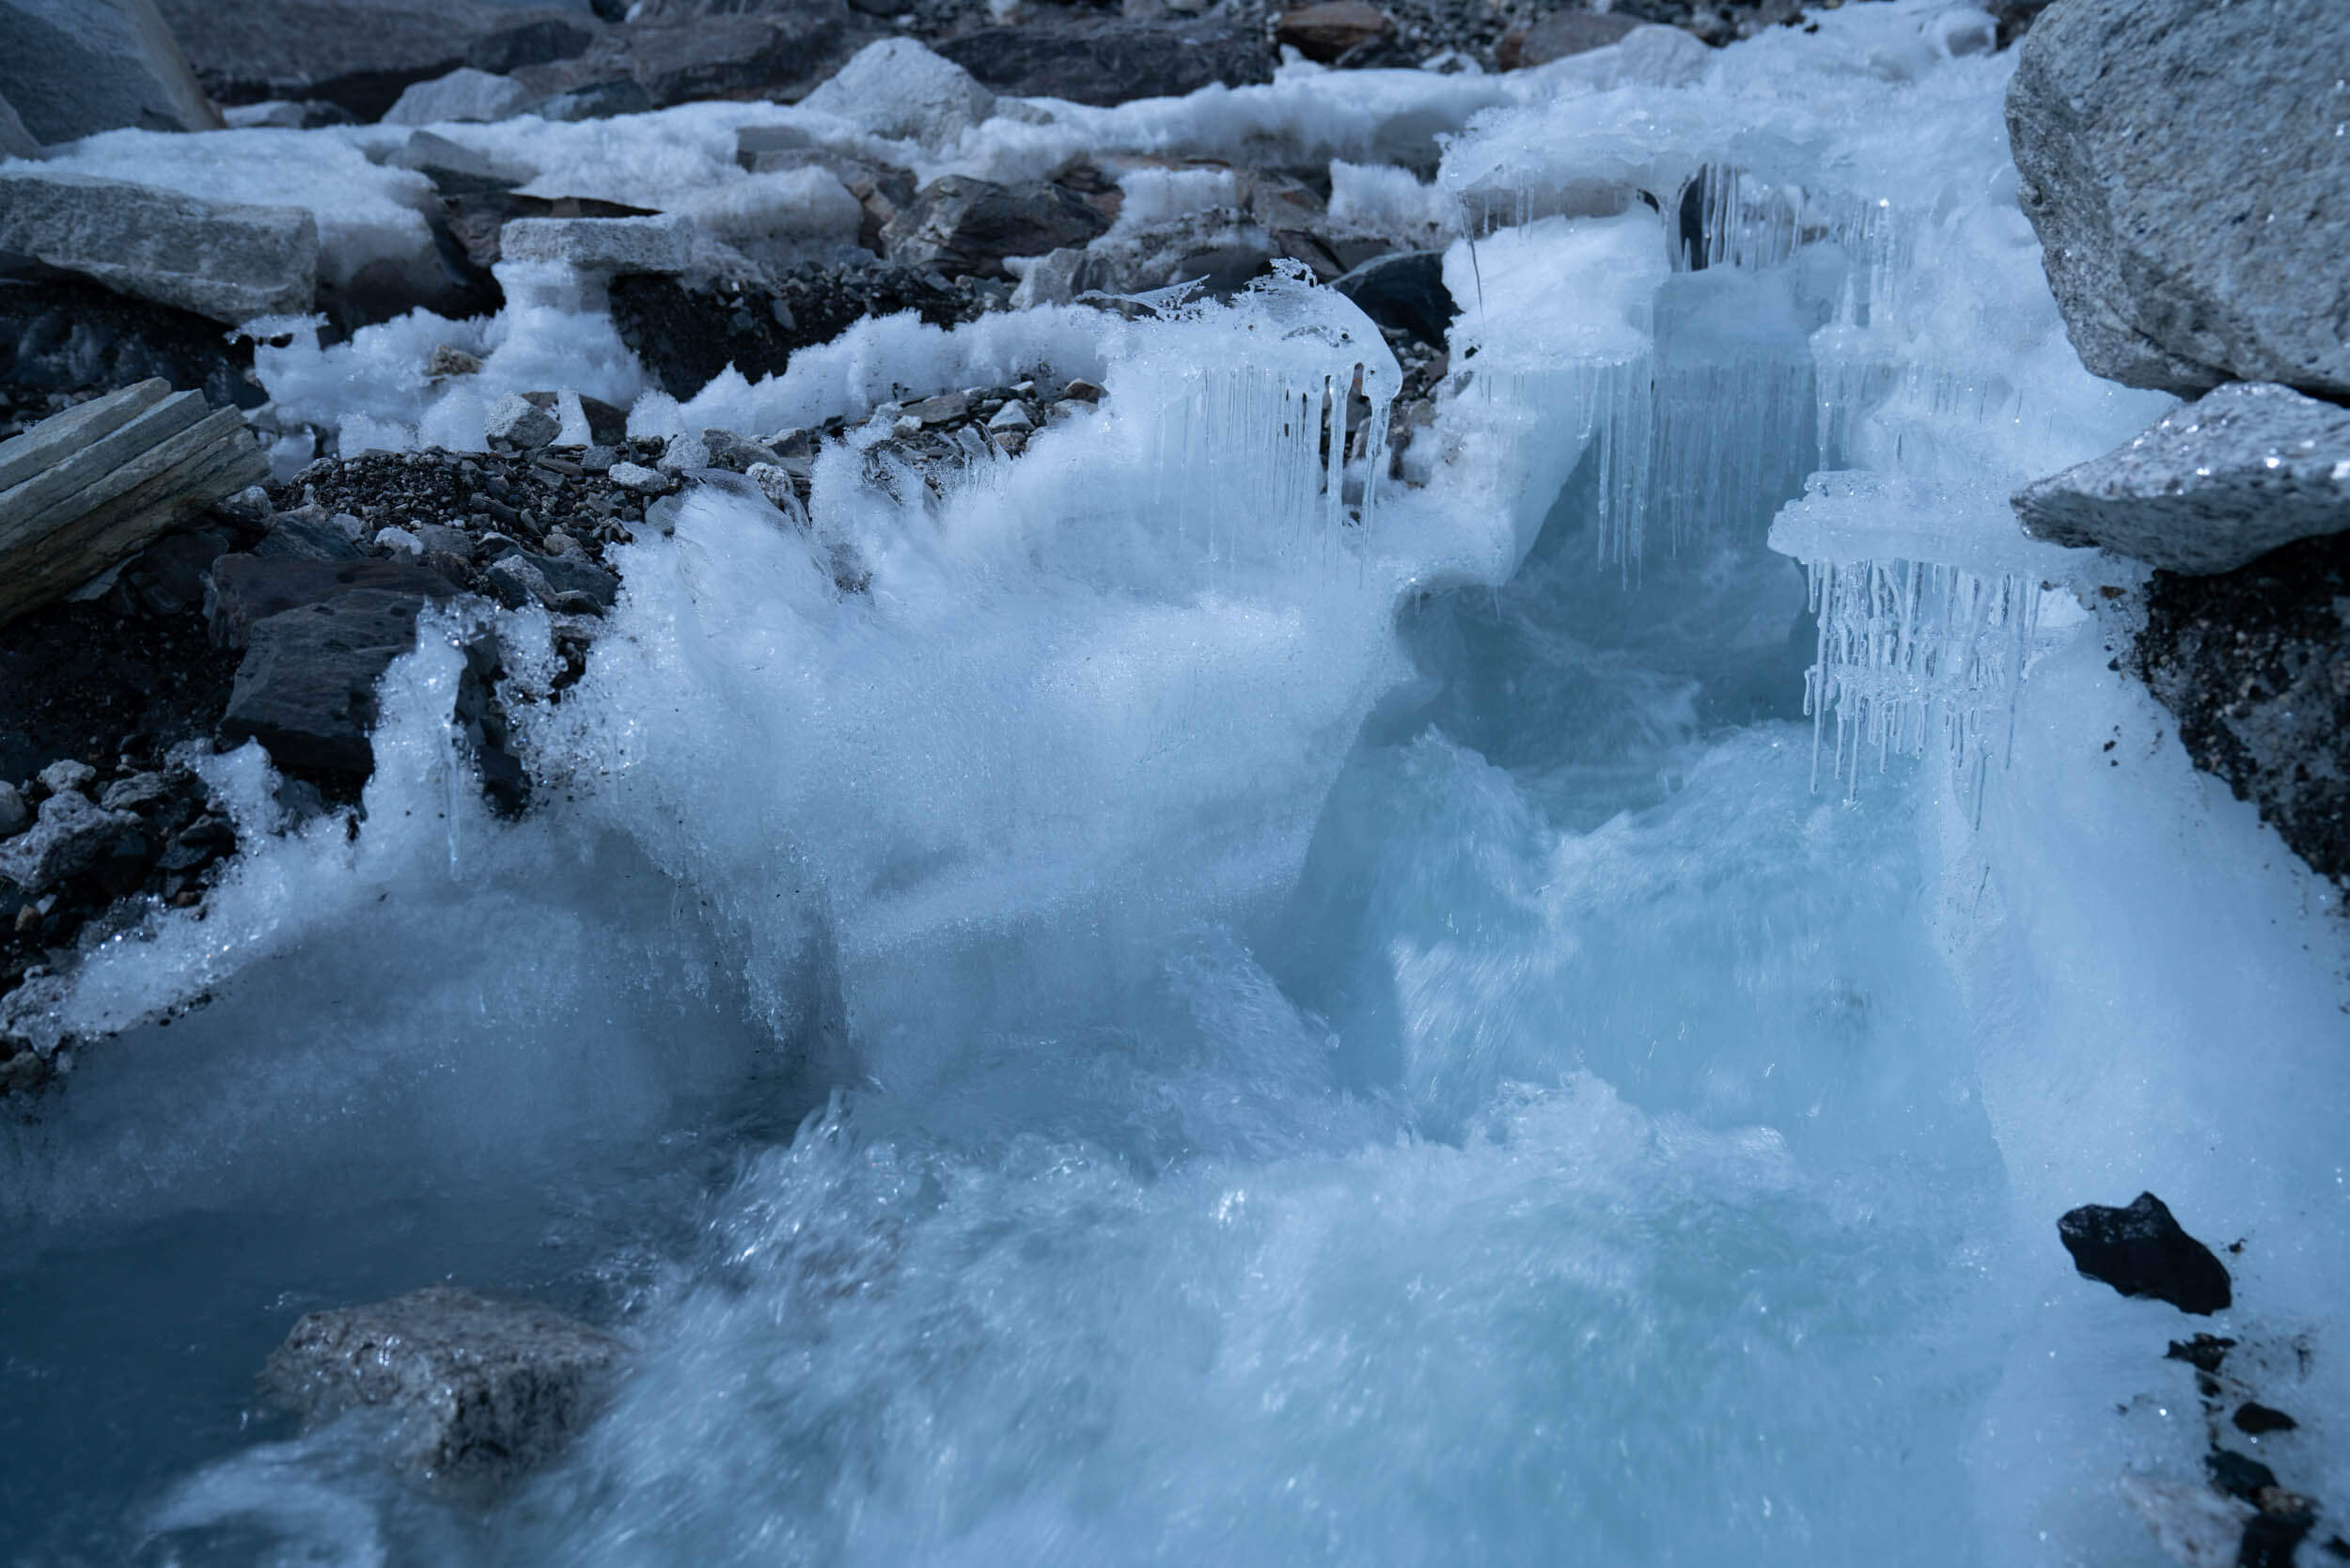
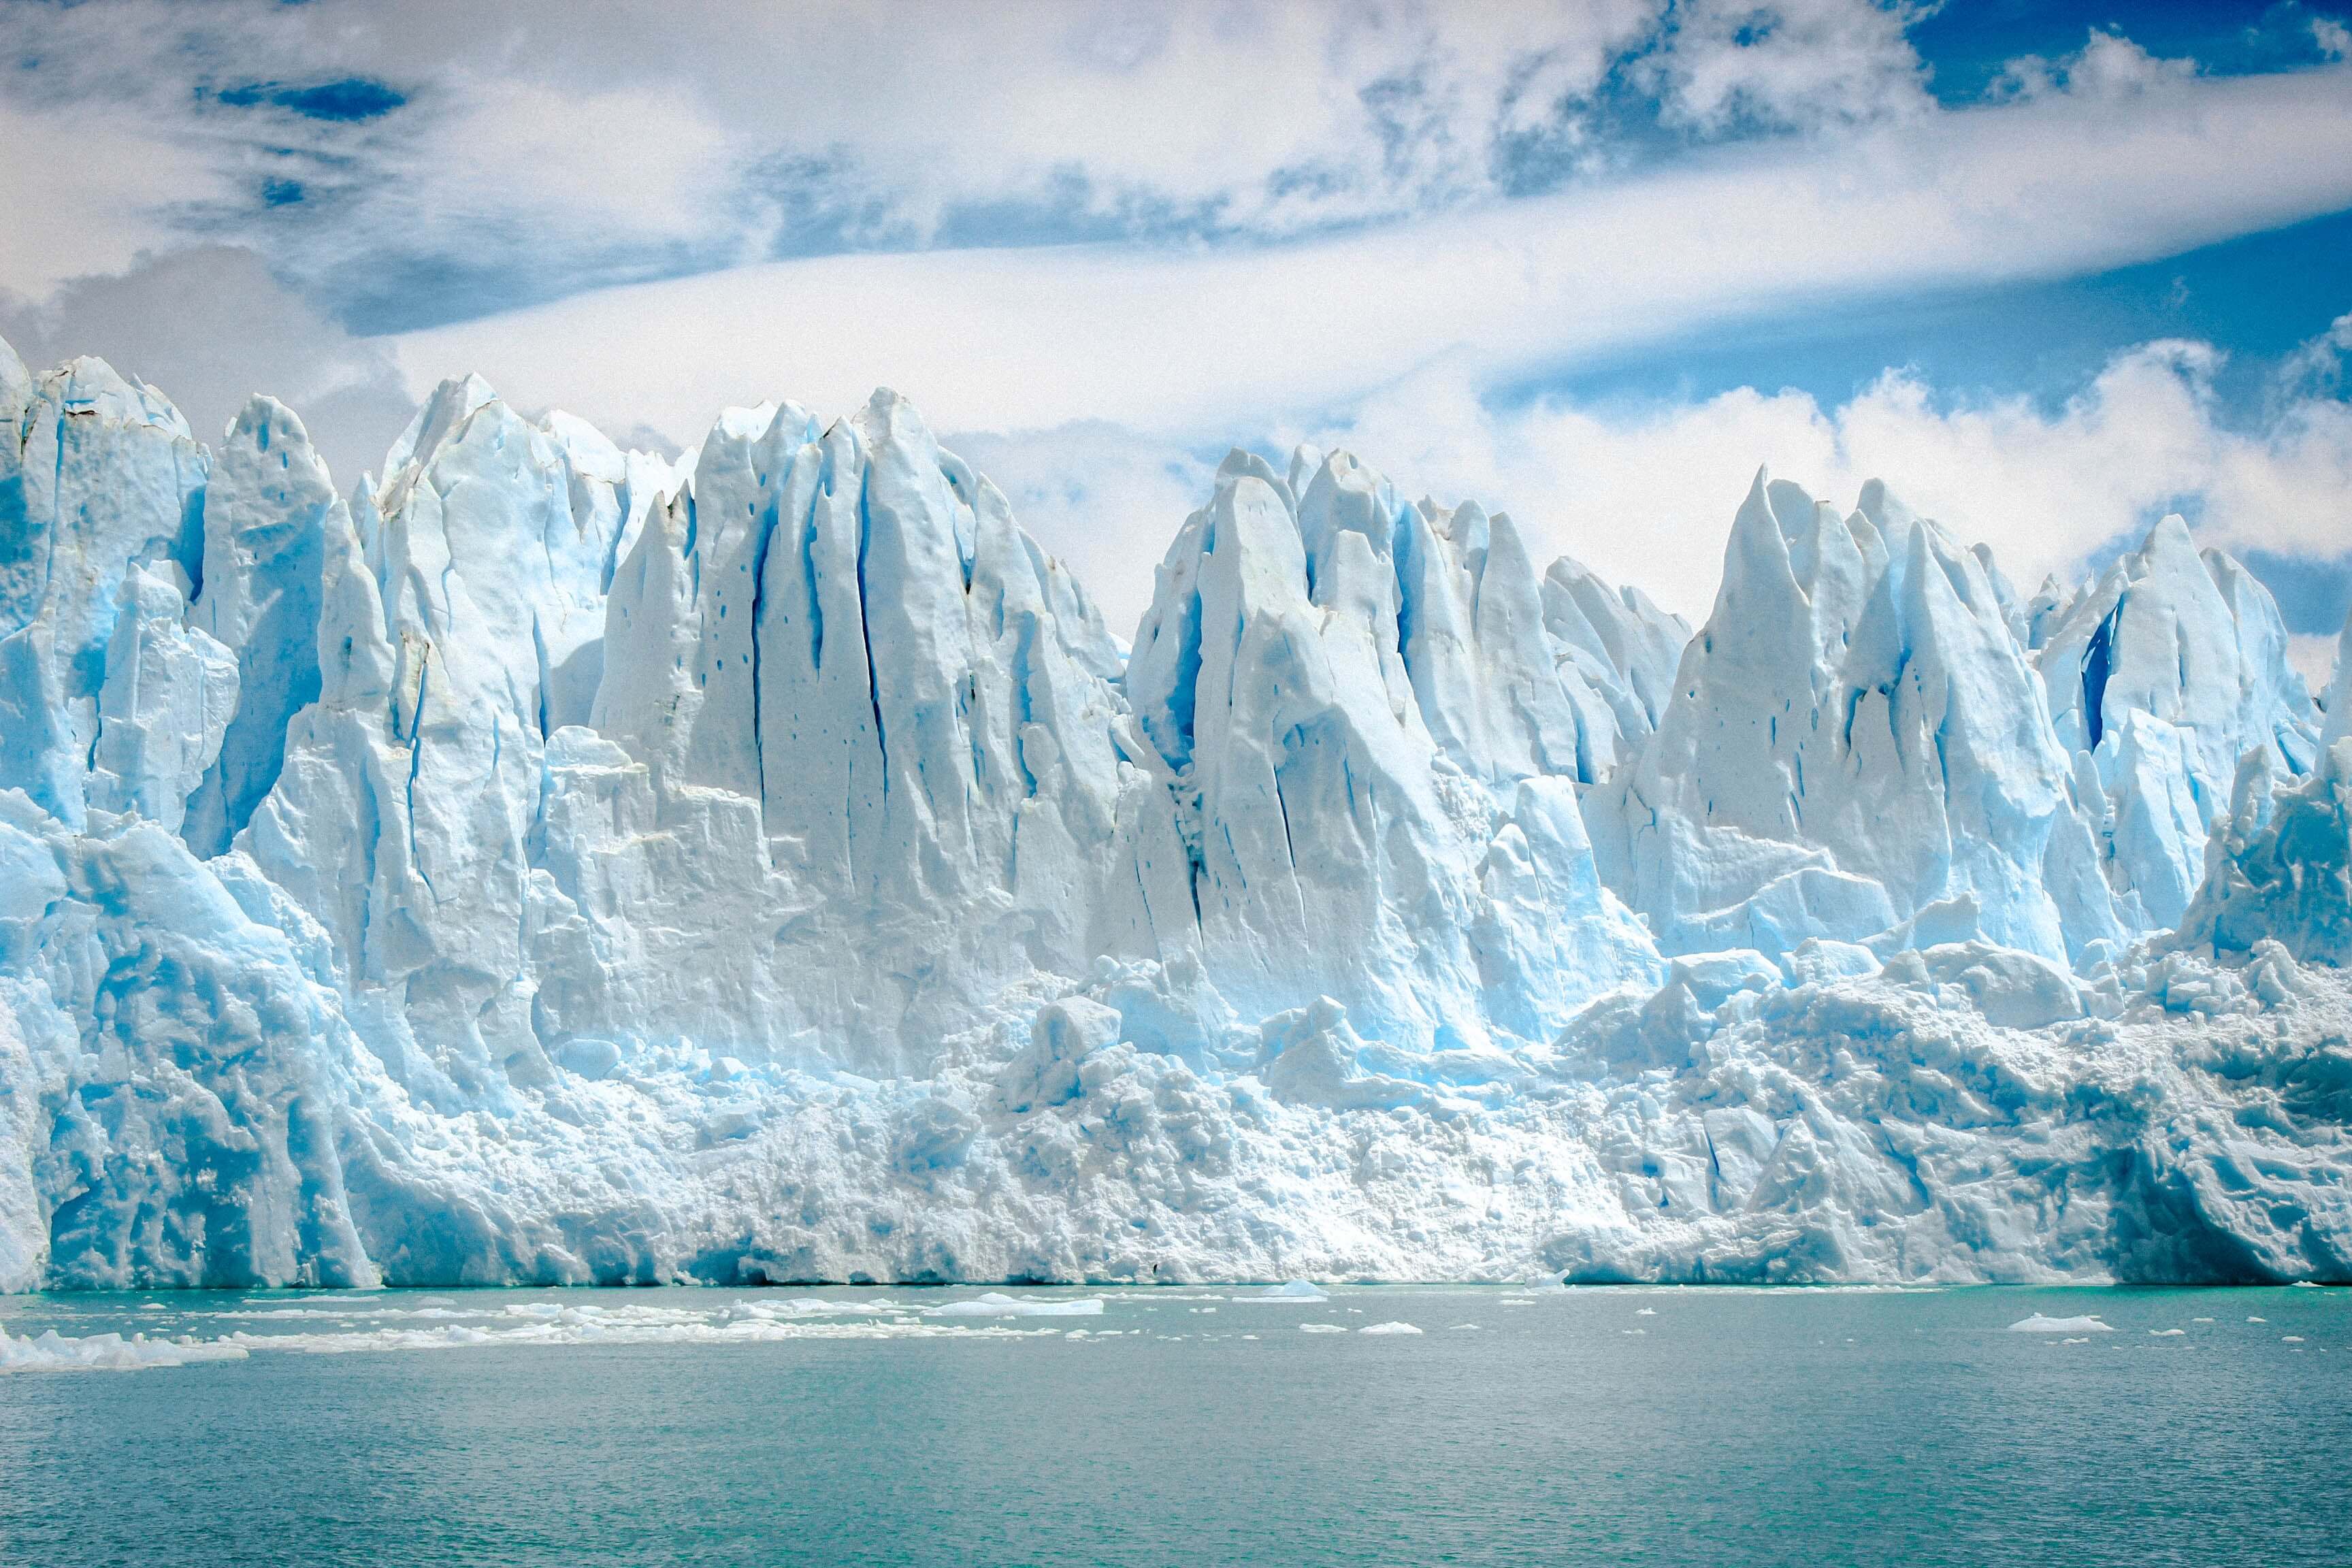
Cryosphere
A subset of the Hydrosphere that consists of frozen water. (Snow and Ice)
The Cryosphere plays a critical role in regulating climate and sea levels.
Around three-quarters of the world’s fresh water is stored in the Cryosphere, primarily in glaciers and ice caps.
The Cryosphere helps regulate Earth’s climate by reflecting incoming solar radiation back into space, a process known as the albedo effect.
Melting ice from the cryosphere contributes to sea level rise, which can impact coastal ecosystems and human settlements.
Source:
https://mynasadata.larc.nasa.gov/basic-page/about-cryosphere
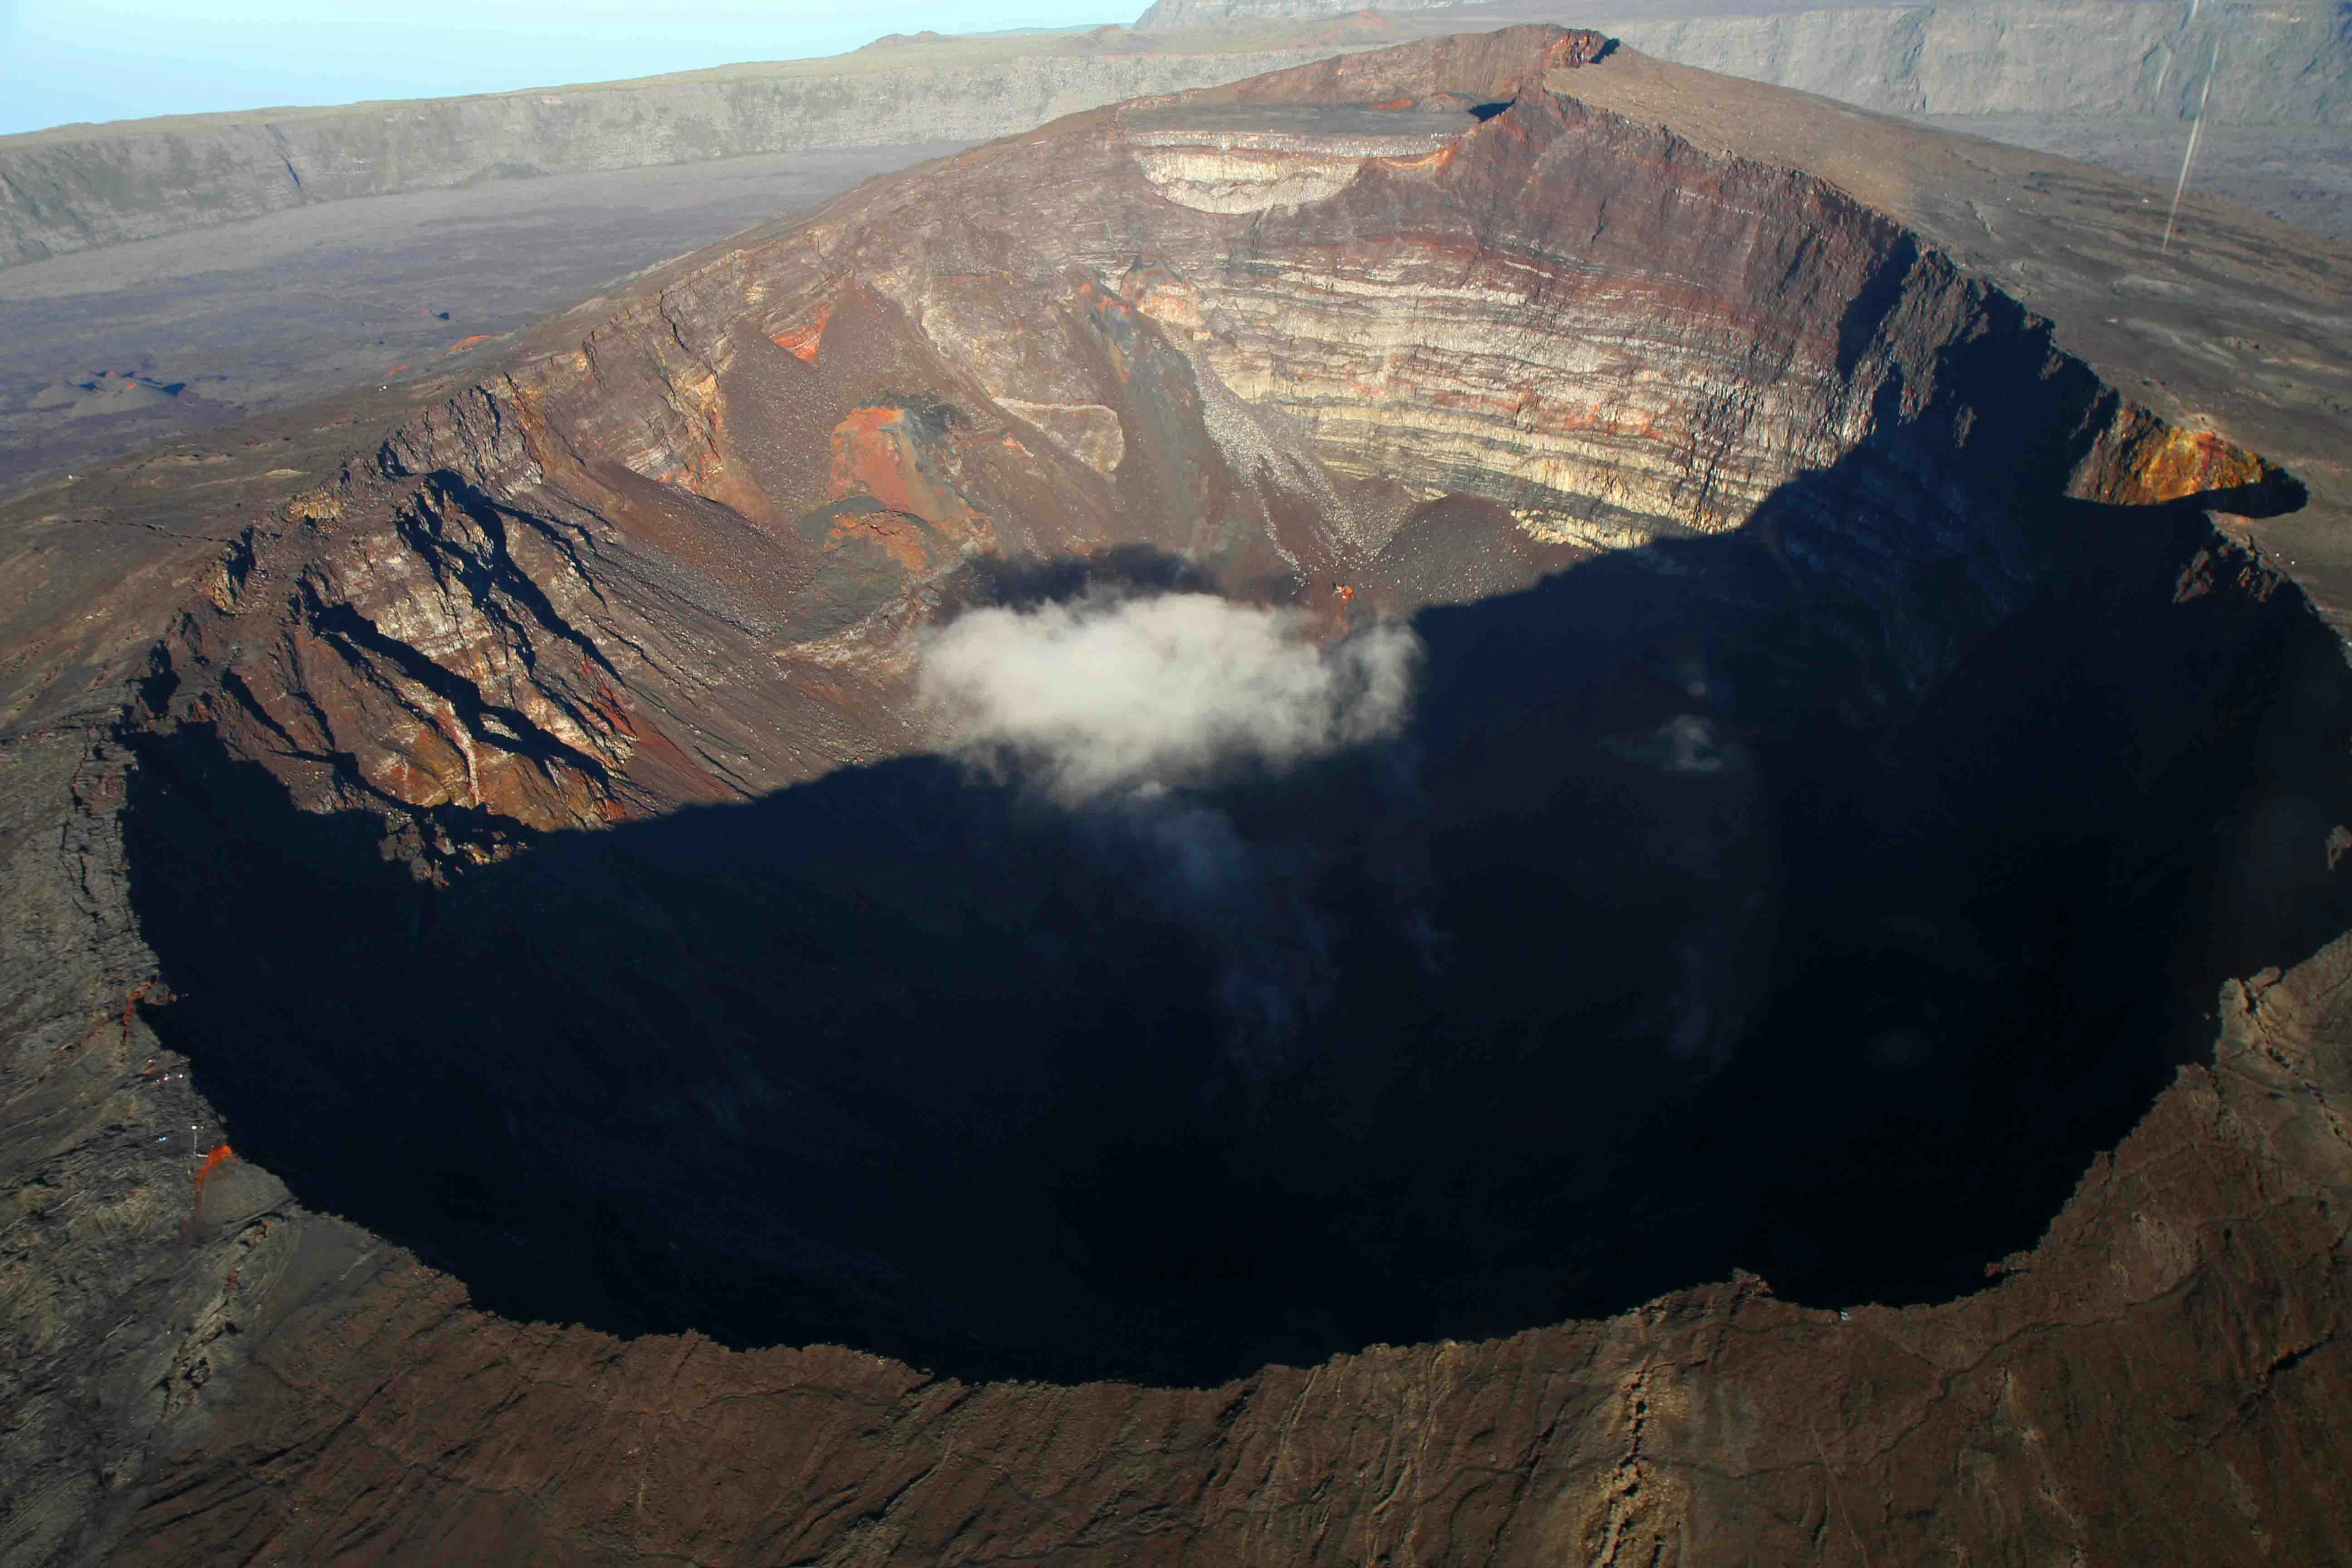
Geosphere
A sphere that includes the solid Earth; the core, mantle, crust and soil layers.
94% of the solid Earth is made up of the following elements: oxygen, iron, silicon, and magnesium.
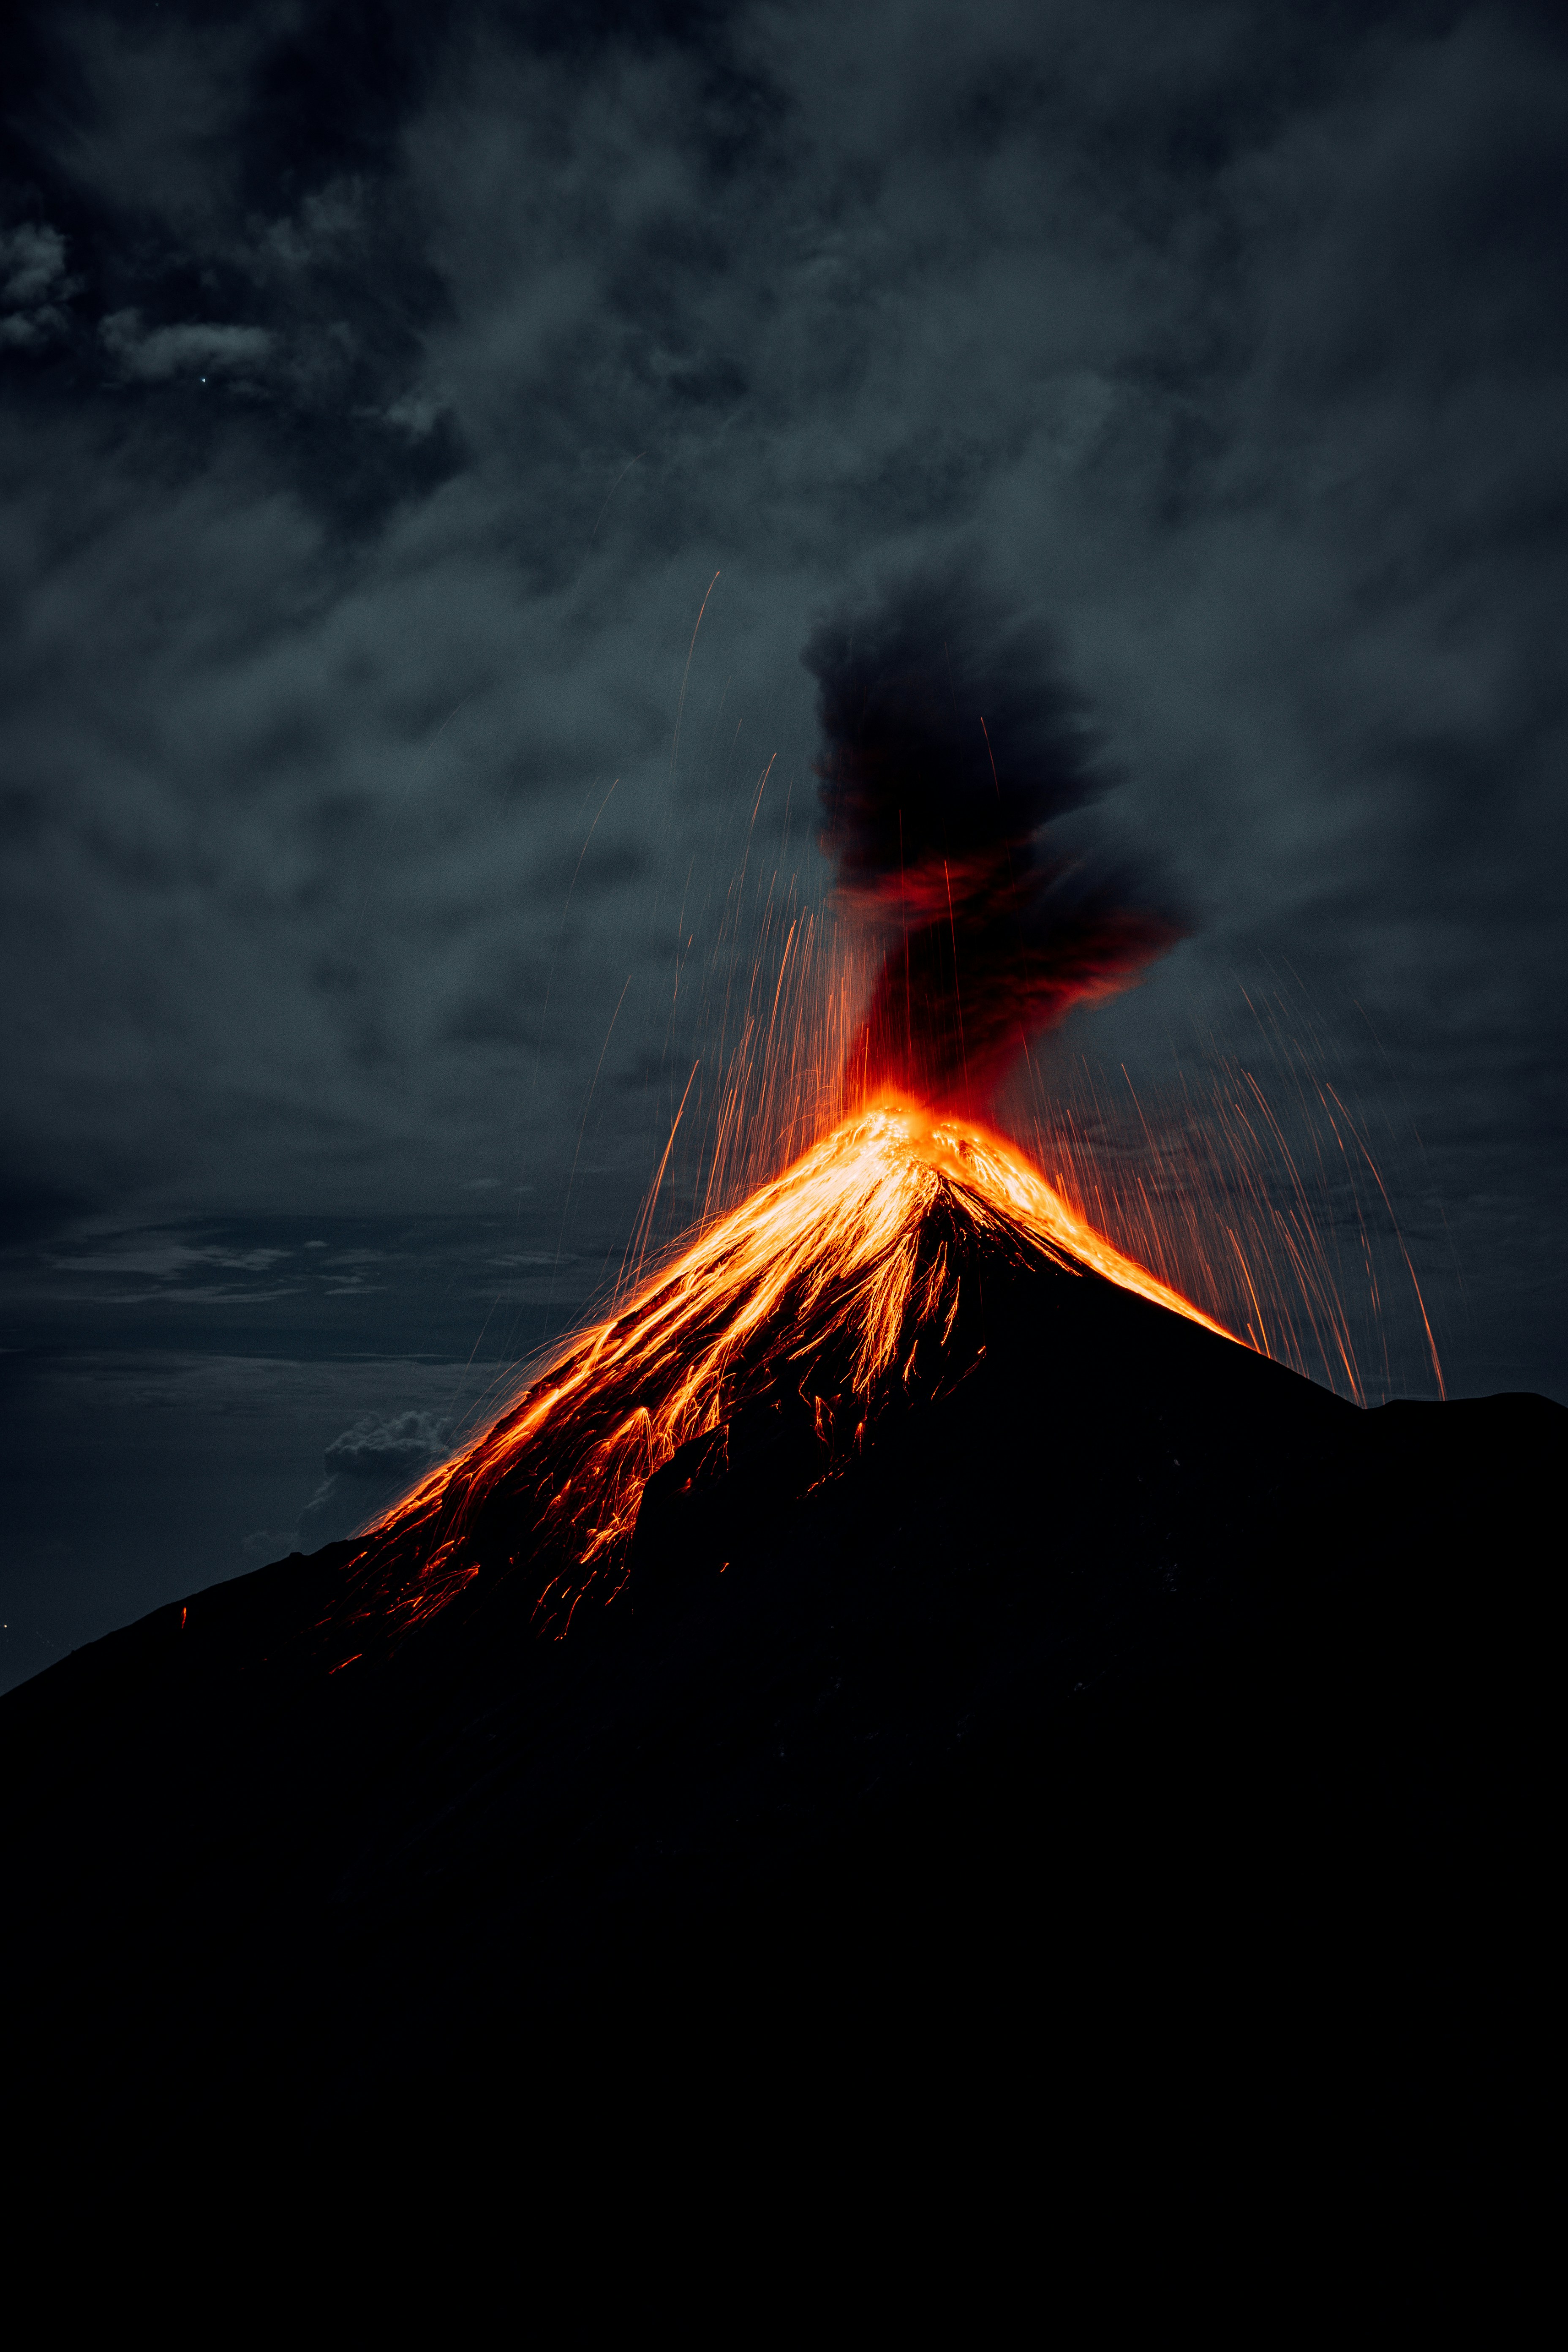
The movement of the tectonic plates causes earthquakes, volcanic eruptions and the formation of mountains.
The geosphere is a source of essential natural resources, including minerals, fossil fuels and soil, which are crucial for human activities and ecosystems.
Source:
https://mynasadata.larc.nasa.gov/basic-page/about-geosphere
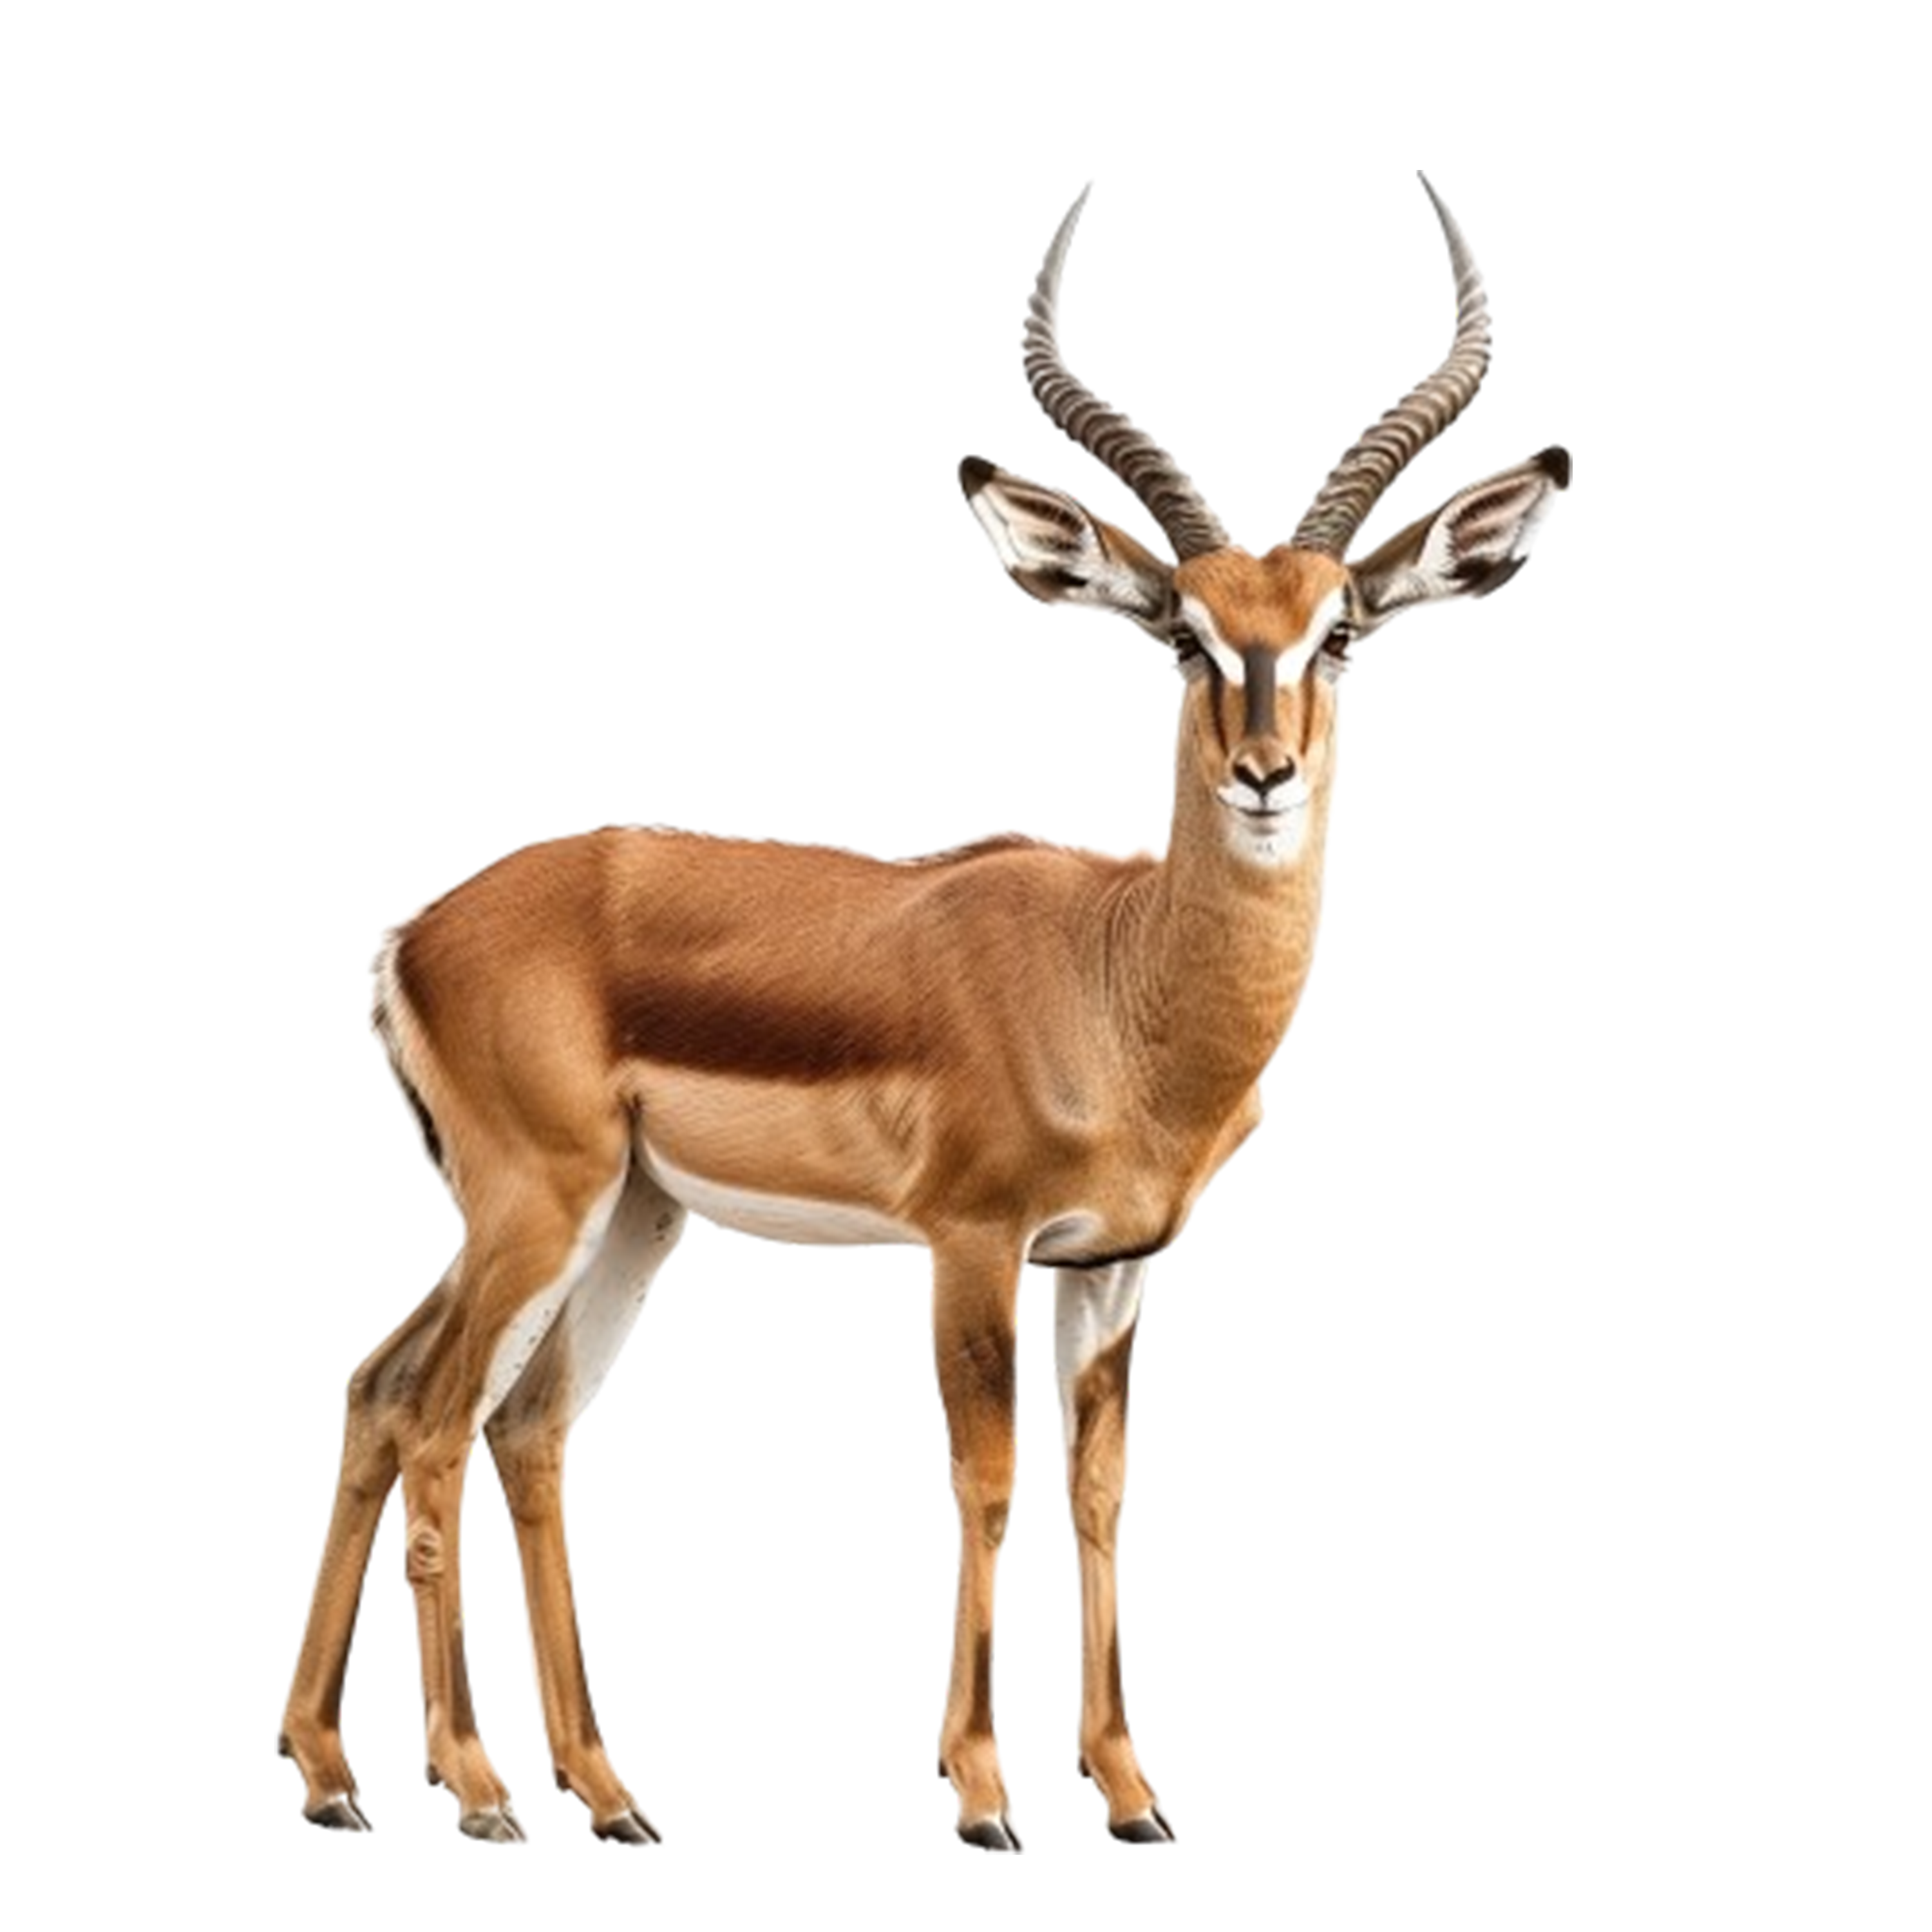
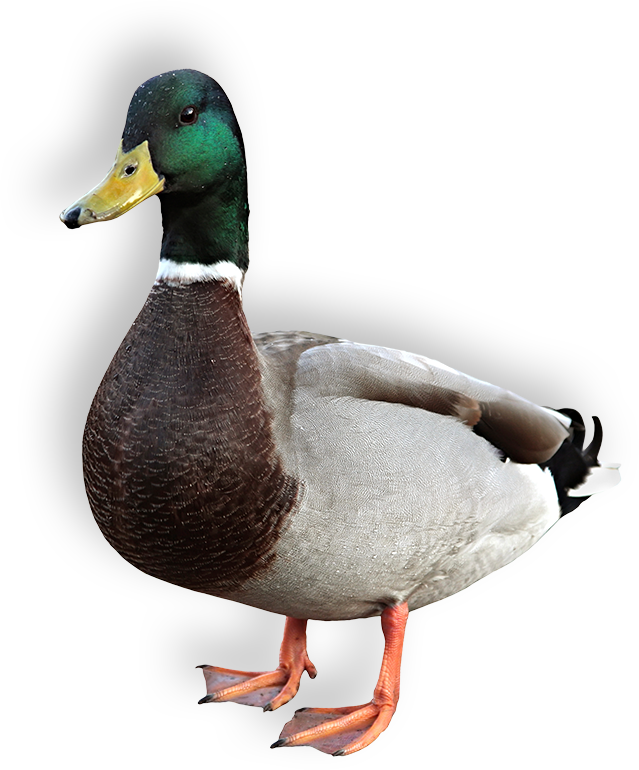
Biosphere
The Biosphere includes all life on Earth including life living on the Earth's Geosphere and in Hydrosphere, including humans and all organic matter that has not yet decomposed.
The Biosphere functions as Earth’s life support system, regulating atmospheric composition, soil health, and the hydrological cycle.
It is home to a vast diversity of life forms, from microorganisms to plants and animals. Biodiversity within the biosphere is crucial for ecosystem stability and resilience.
The biosphere helps regulate Earth’s climate by influencing the carbon cycle and other biogeochemical cycles.
The biosphere interacts with the atmosphere, hydrosphere, and geosphere, creating a complex web of interdependencies that sustain life on Earth.
Source:
https://mynasadata.larc.nasa.gov/basic-page/about-biosphere


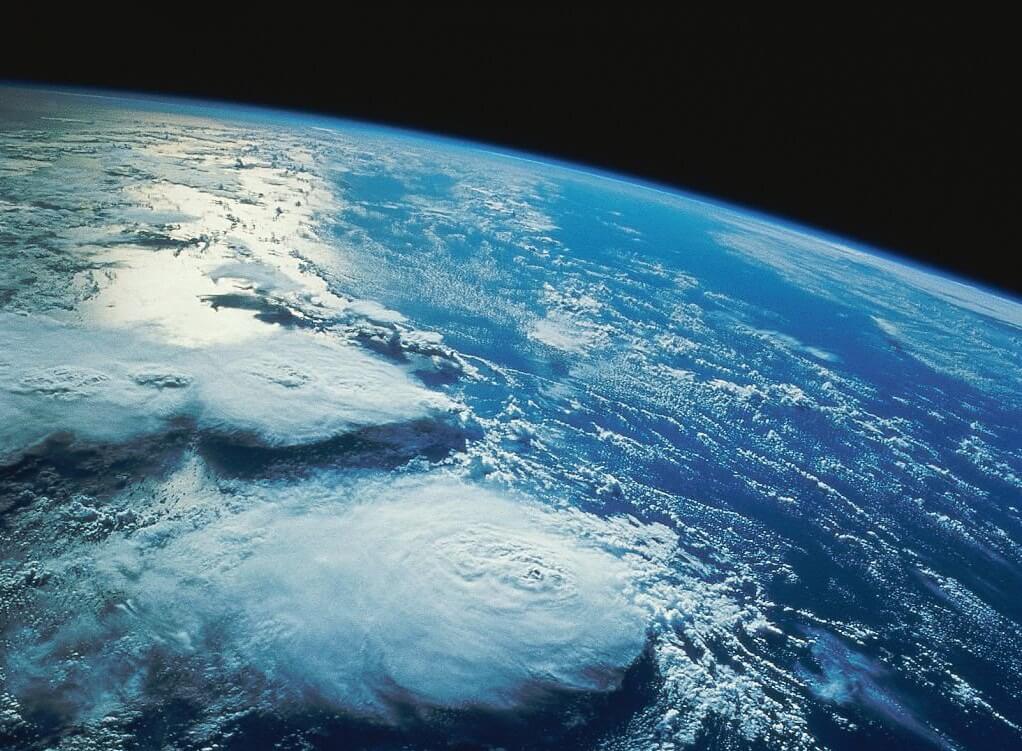
The temperature level
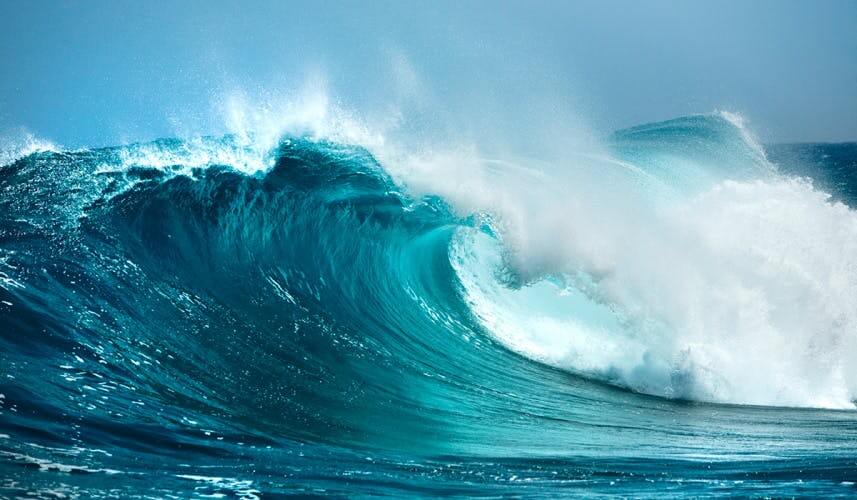
The Water level
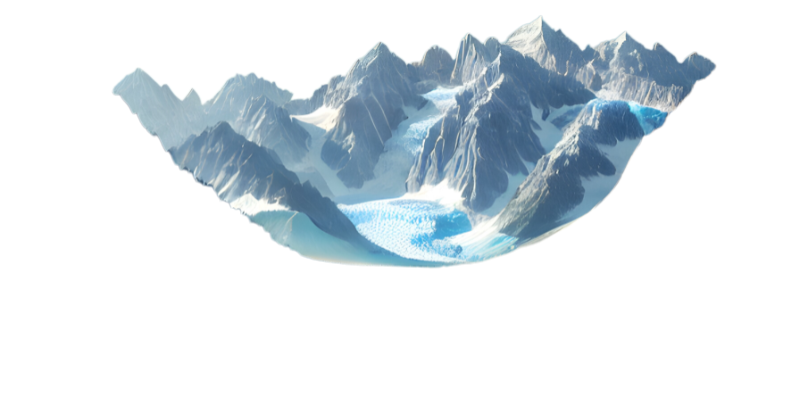
The glacier level increasing
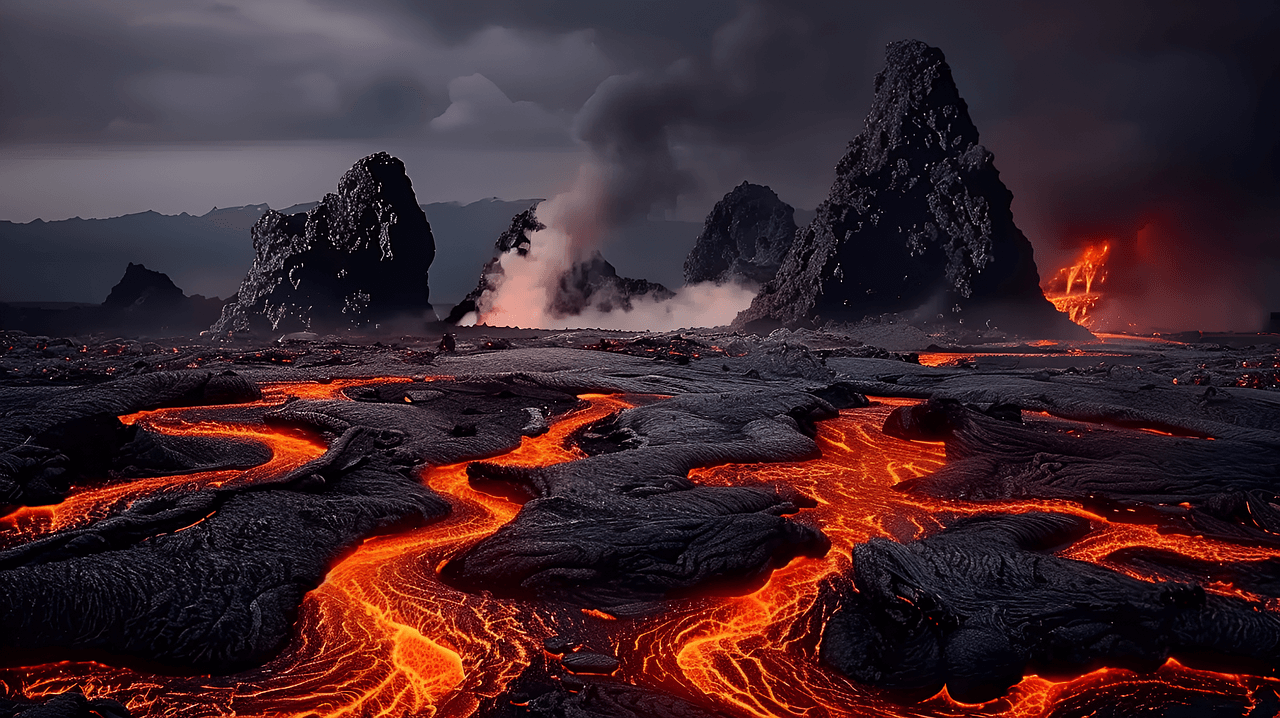
The lava level
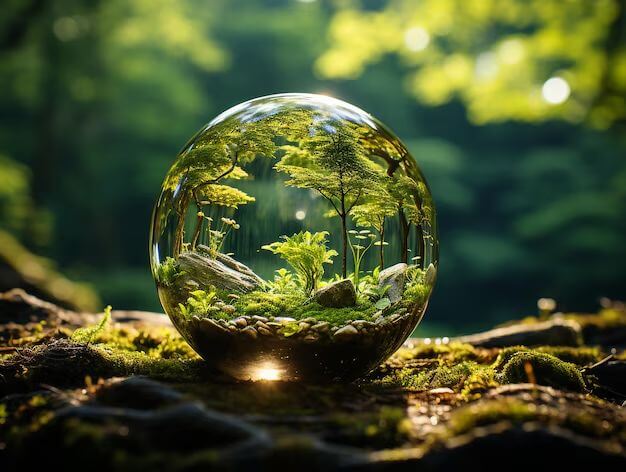
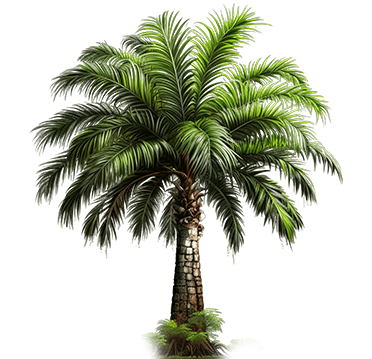
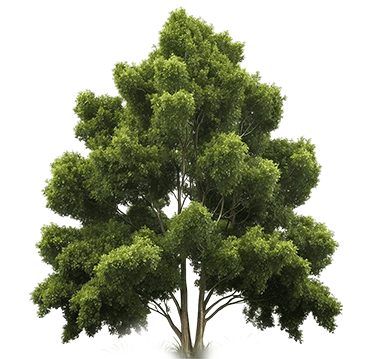
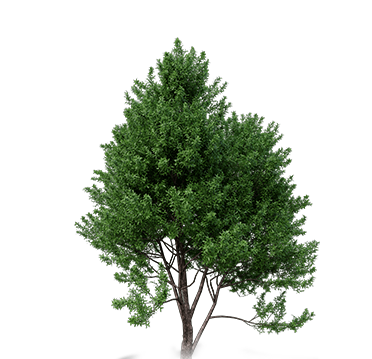
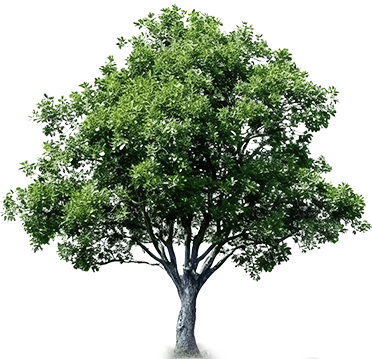
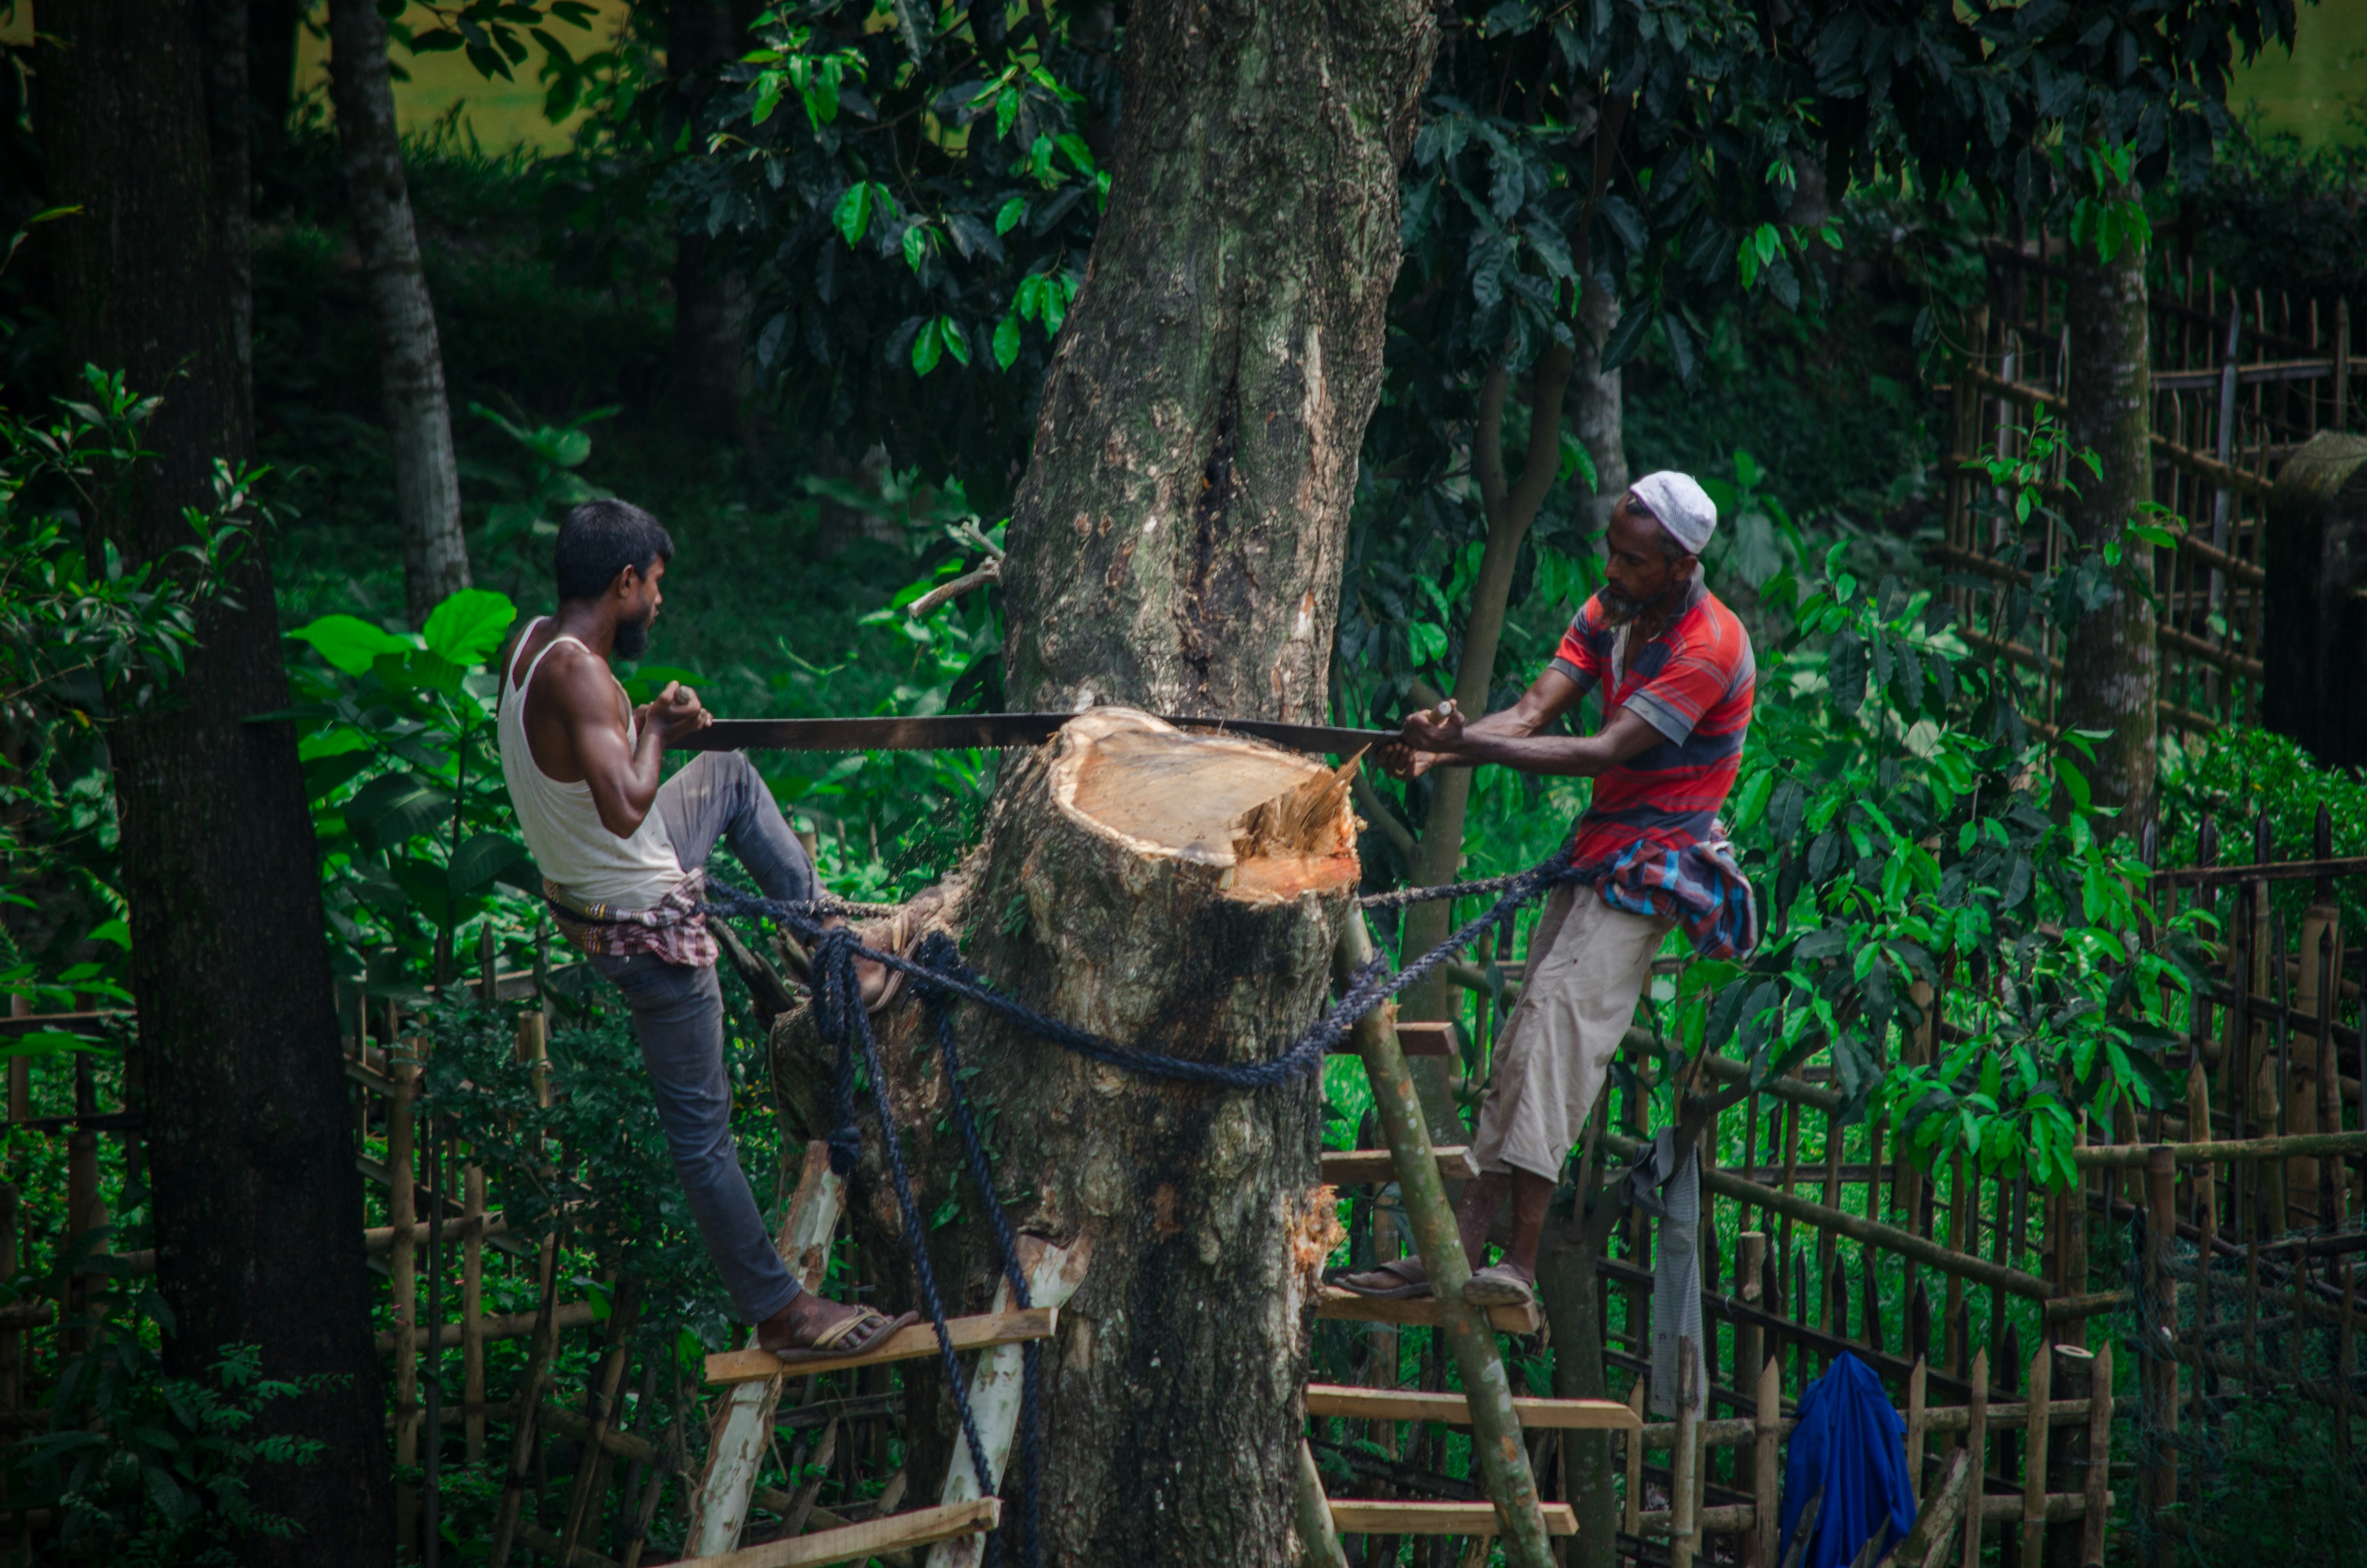
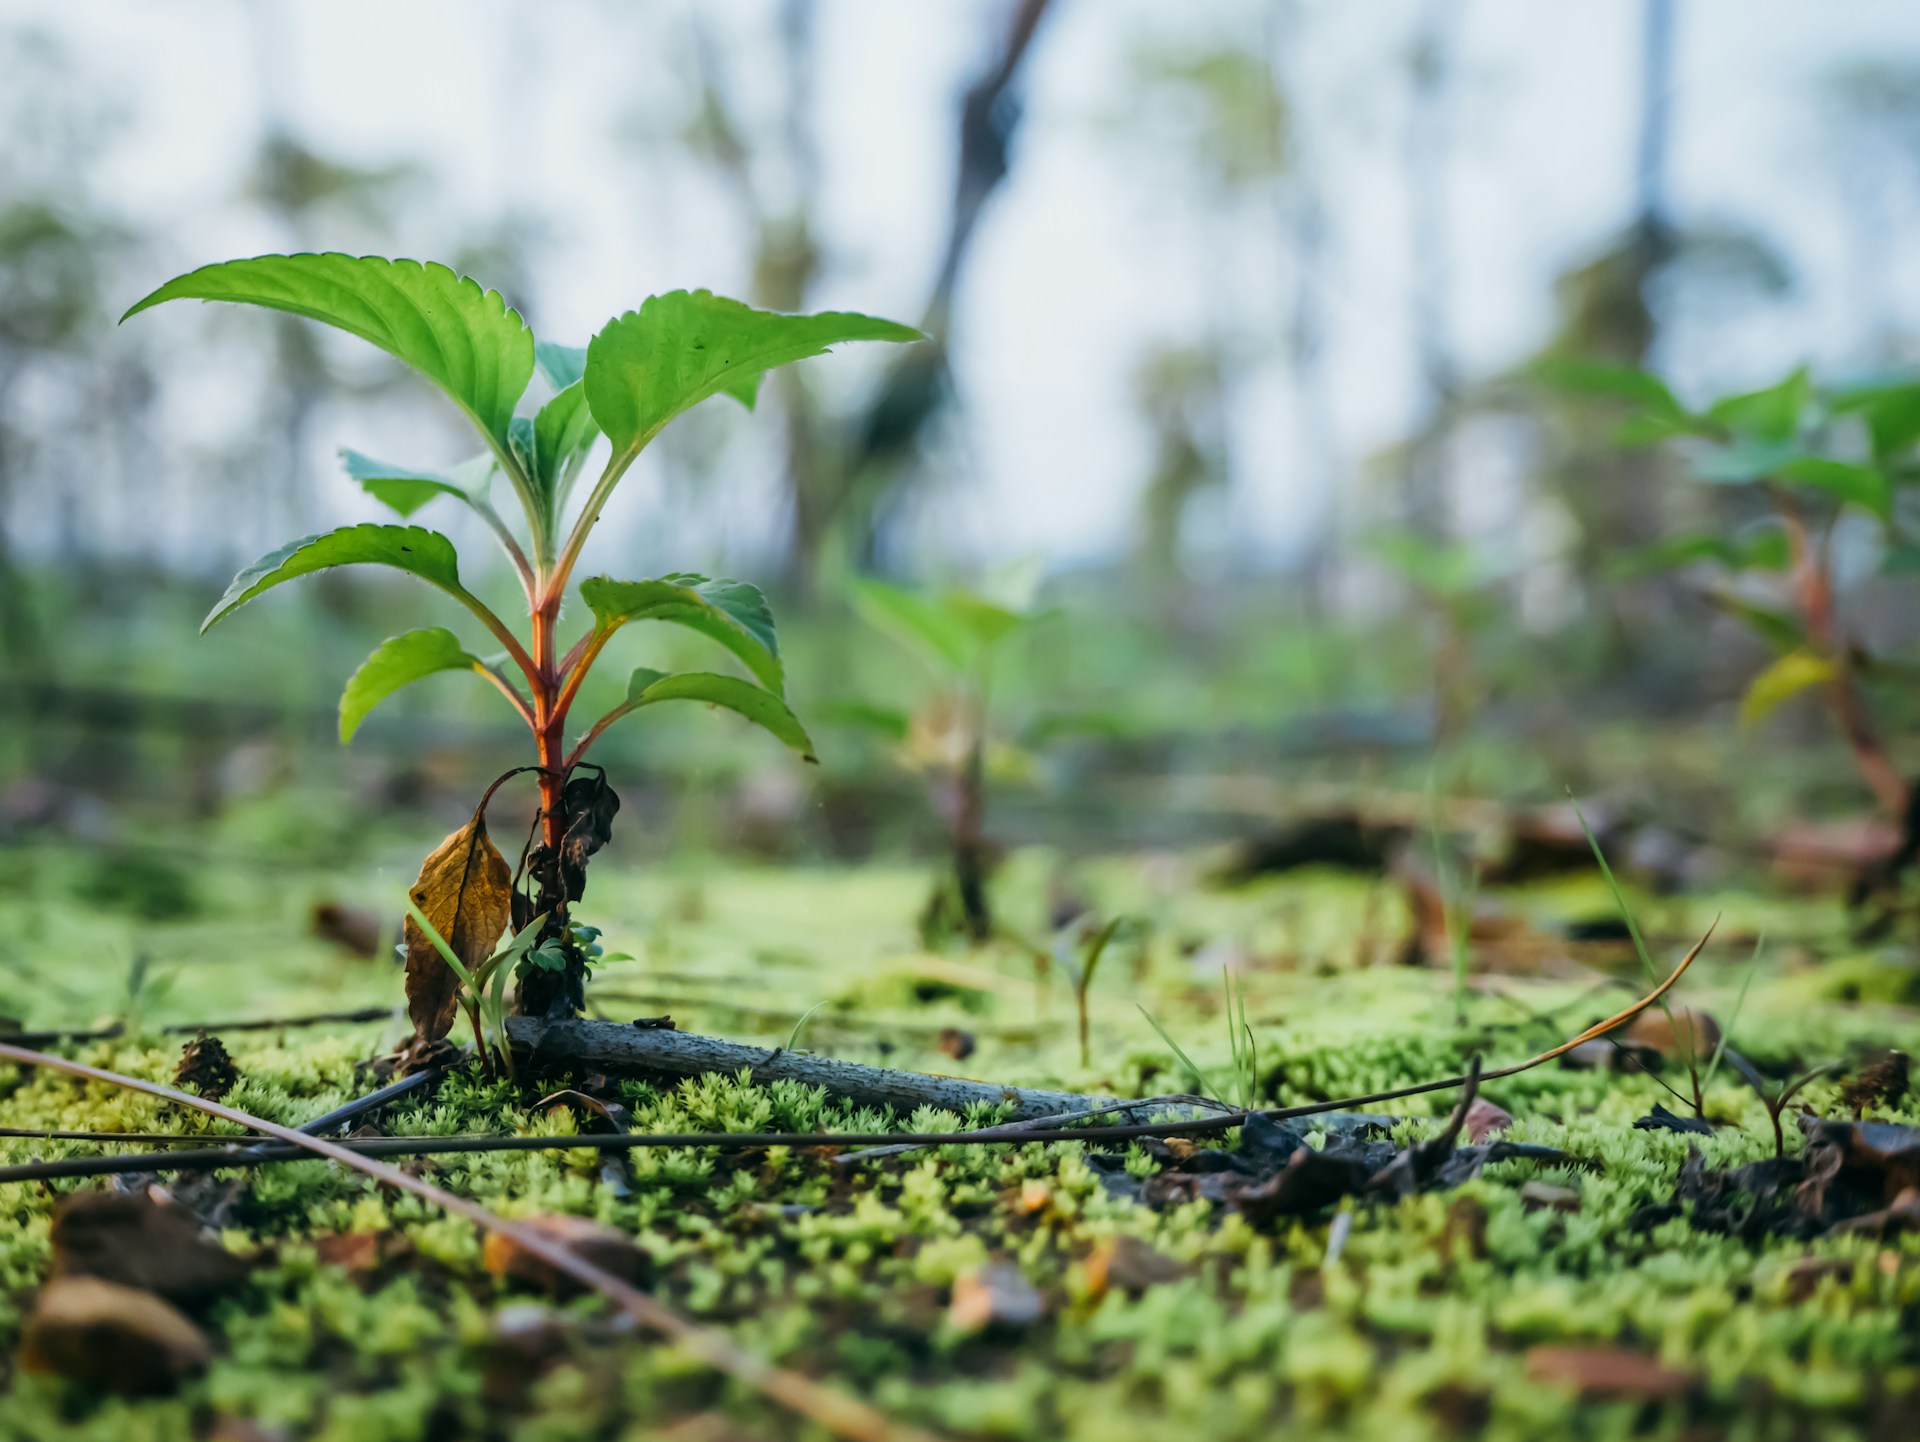
The trees level increasing
Our Earth is a beautifully interconnected system
shaped
by even
our smallest actions
Let's Explore
Atmosphere
How does it affect other systems?
Hydrosphere
Atmospheric changes lead to evaporation, changing rainfall patterns & ocean temperatures.
Biosphere
Warmer or polluted air affects plant growth, animal migration, and ecosystem stability.
Cryosphere
Higher temperatures result in the melting of glaciers, sea ice, and permafrost.
Geosphere
Changes in temperature can accelerate erosion and alter soil stability.
Natural Causes: Volcanic eruptions, solar radiation, and variations in Earth's orbit can change temperature, air pressure, and gas composition.
Human Impact: Industrial emissions (e.g., CO₂, methane), deforestation, and pollution contribute to changes like global warming and ozone depletion.
Hydrosphere
How does it affect other systems?
Atmosphere
Water vapor is a major greenhouse gas. Changes in ocean temperatures can lead to shifts in climate and weather patterns (e.g., El Niño and La Niña).
Biosphere
Water availability directly affects ecosystems, plant life, and agriculture, influencing biodiversity and food security.
Cryosphere
Warmer ocean water accelerates ice melt in the Polar Regions and glaciers, contributing to rising sea levels.
Geosphere
Excess water (floods) leads to erosion, while droughts contribute to desertification.
Natural Causes: Ocean currents, evaporation, precipitation, and melting ice caps affect sea levels and water distribution.
Human Impact: Pollution, damming rivers, and over-extraction of groundwater disrupt the water cycle and contribute to phenomena like desertification and ocean acidification.
Cryosphere
How does it affect other systems?
Atmosphere
As ice melts, less sunlight is reflected, and more heat is absorbed by the Earth’s surface (albedo effect), contributing to warming.
Hydrosphere
Melting glaciers and ice caps contribute to rising sea levels and change freshwater availability, particularly in regions that rely on glacial melt for water.
Biosphere
Melting ice disrupts habitats for polar species like penguins and seals. Changes in sea levels also impact coastal ecosystems and human settlements.
Geosphere
Melting permafrost can release stored methane, a potent greenhouse gas, contributing to further warming.
Natural Causes: Changes in Earth's orbit and solar radiation can influence the size and extent of ice sheets, glaciers, and permafrost.
Human Impact: Global warming accelerates the melting of ice caps and glaciers, contributing to rising sea levels and loss of habitat for polar species.
GeoSphere
How does it affect other systems?
Atmosphere
Volcanic eruptions release gases and particles into the air, sometimes causing cooling by reflecting sunlight or warming by adding greenhouse gases.
Hydrosphere
Earthquakes and land changes can trigger tsunamis, while soil erosion affects river sedimentation and water quality.
Biosphere
Erosion, land degradation, and habitat destruction reduce the availability of fertile soil for plants, impacting biodiversity and food production.
Cryosphere
Geological changes such as uplift or subsidence can influence the stability of glaciers and ice sheets.
Natural Causes: Plate tectonics, earthquakes, and volcanic activity reshape landforms and trigger events like mountain formation and earthquakes.
Human Impact: Mining, deforestation, and construction affect soil stability, erosion, and land degradation.
Biosphere
How does it affect other systems?
Atmosphere
Deforestation reduces the number of trees that absorb CO₂, increasing greenhouse gases. The loss of plant cover also affects local weather and climate patterns.
Hydrosphere
Ecosystem changes can alter the water cycle, affecting river flow, groundwater levels, and water purification processes.
Cryosphere
Changes in ecosystems, especially in Polar Regions, influence species that depend on ice and snow for survival, such as polar bears and seals.
Geosphere
Vegetation helps stabilize soils, reducing erosion. Habitat loss from deforestation or agriculture increases soil erosion and degrades land quality.
Natural Causes: Evolution, natural disasters, and climate changes can shift species distribution and
Human Impact: Deforestation, habitat destruction, pollution, and agriculture are reshaping ecosystems, leading to species extinction and biodiversity loss.
-
18C of temperature
18C 52C
-
20% of Water Level
20% 150%
-
80km glaciers
40km 80km
-
0% of Volcano
0% 100%
-
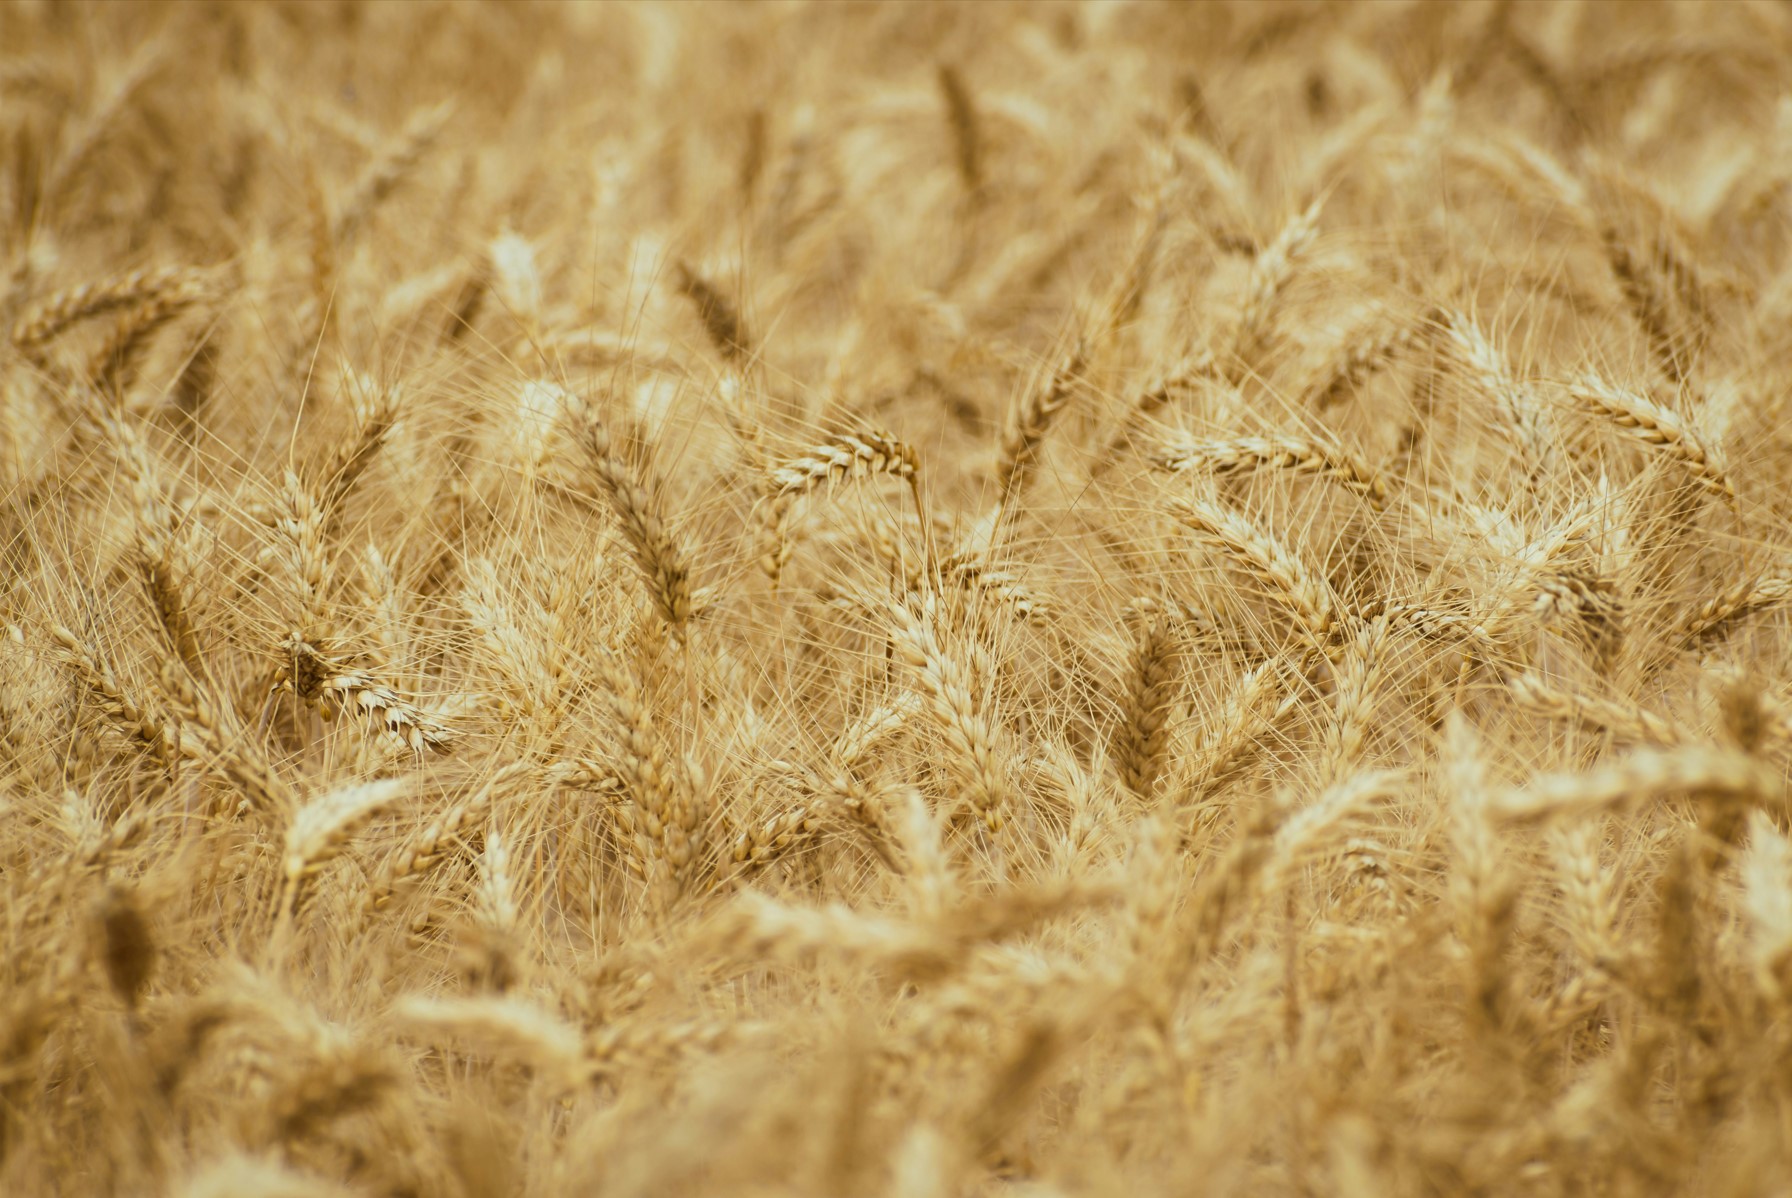
100% of Trees
0% 100%
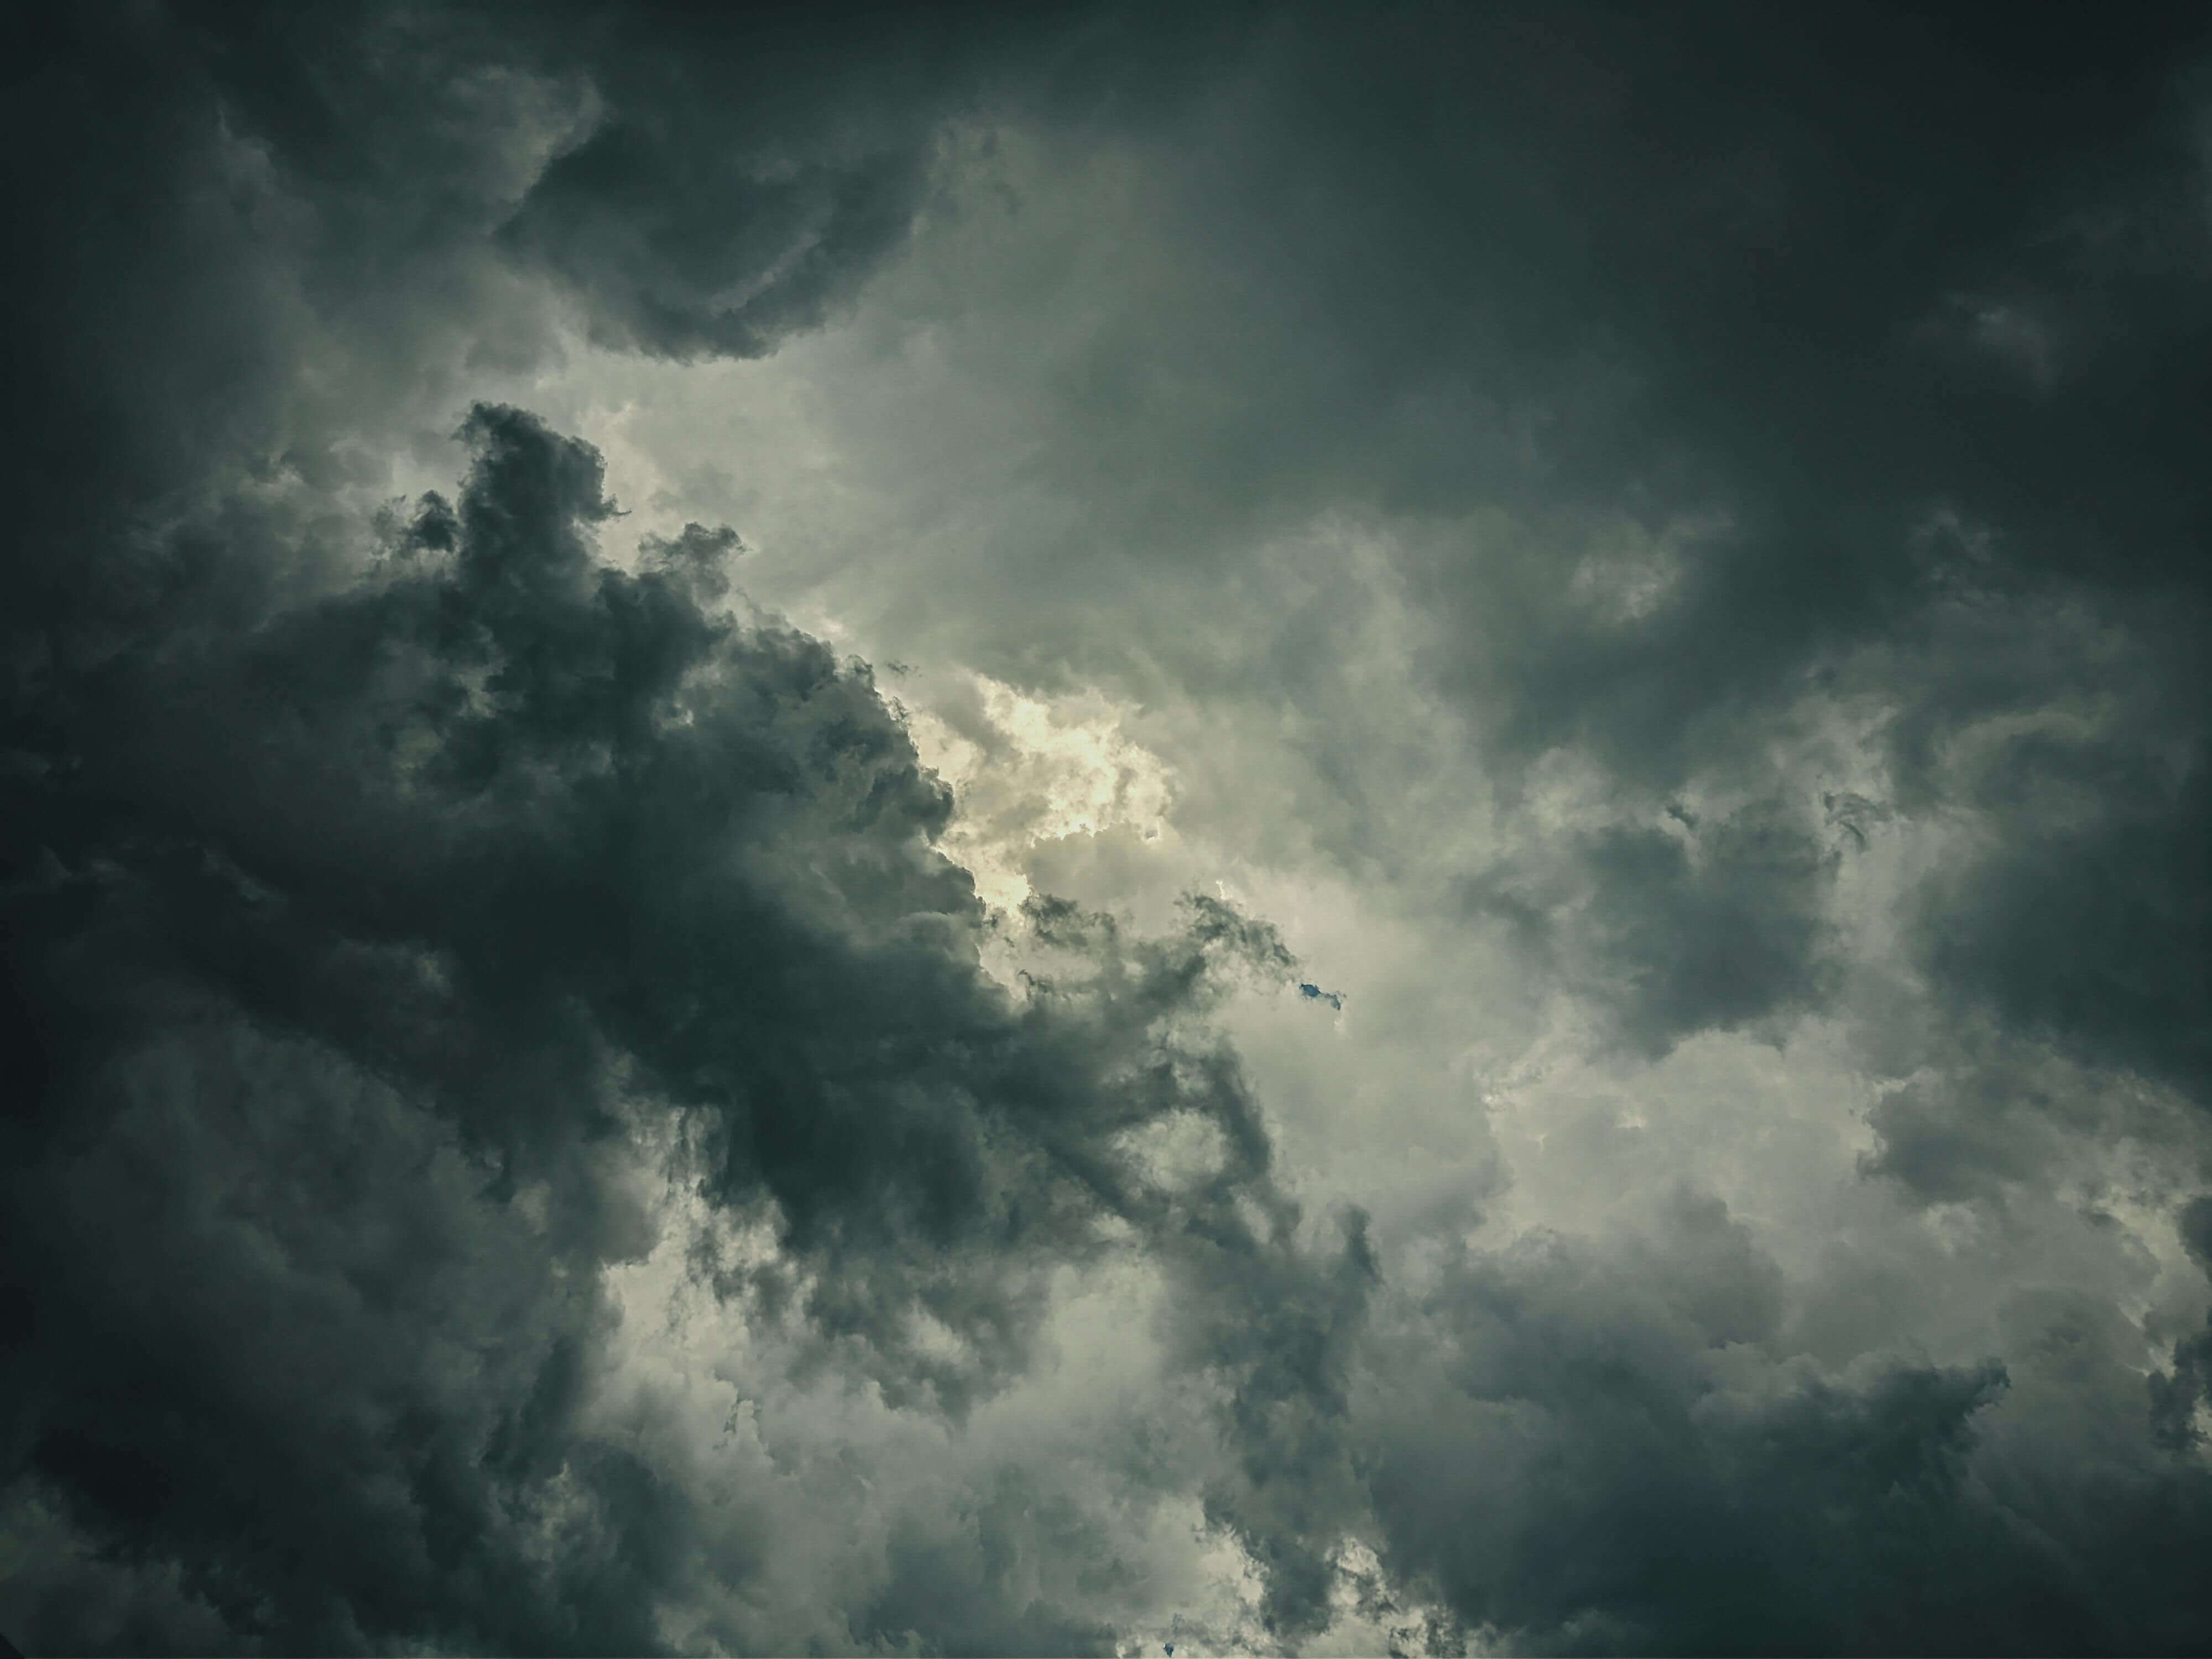
Climate Change
What is climate?
According to NASA ,
climate refers to the long-term average of weather patterns that
define Earth’s local, regional, and global climates. These patterns include
temperature, precipitation, and other weather variables averaged over several
decades.Climate change increases the frequency and severity of natural
hazards like heatwaves, floods, droughts, and storms by altering
temperatures, precipitation patterns, and sea levels.
Climate Change Elements
COMING SOON...
COMING SOON...
COMING SOON...
COMING SOON...
COMING SOON...
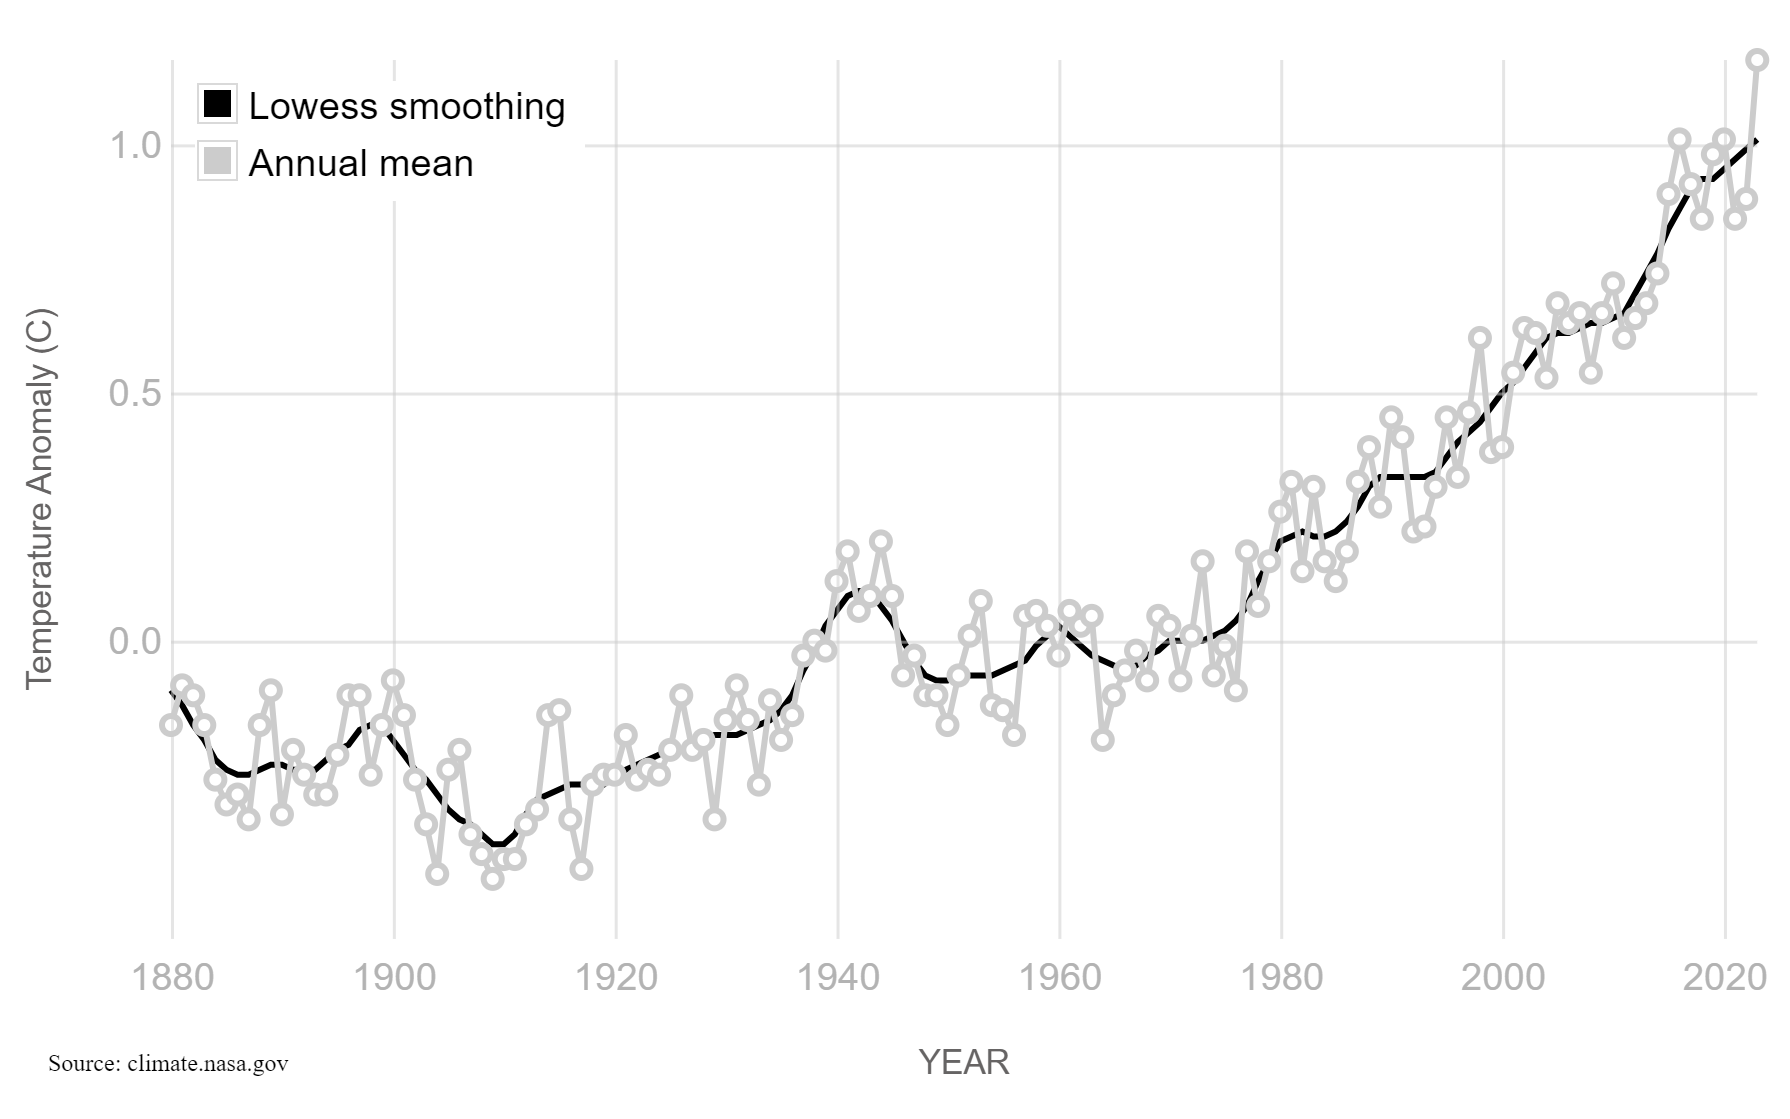
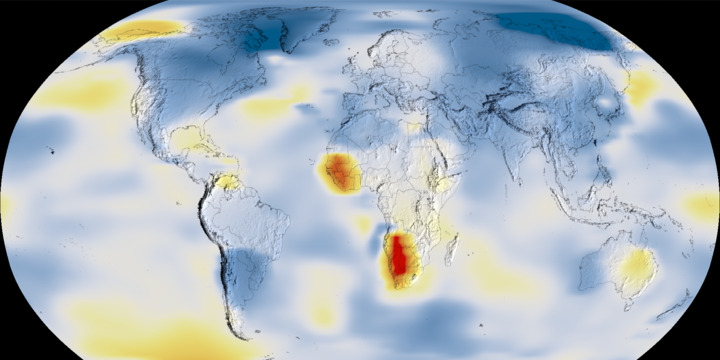
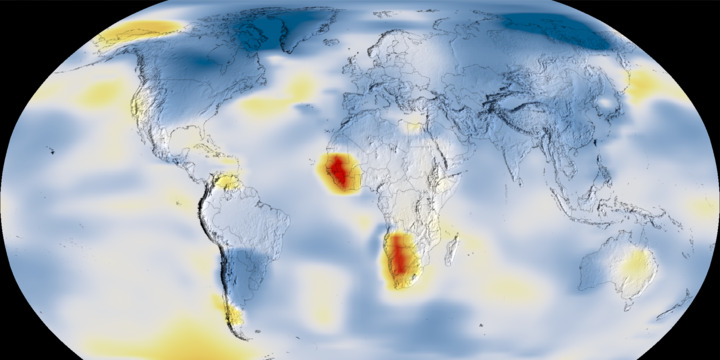
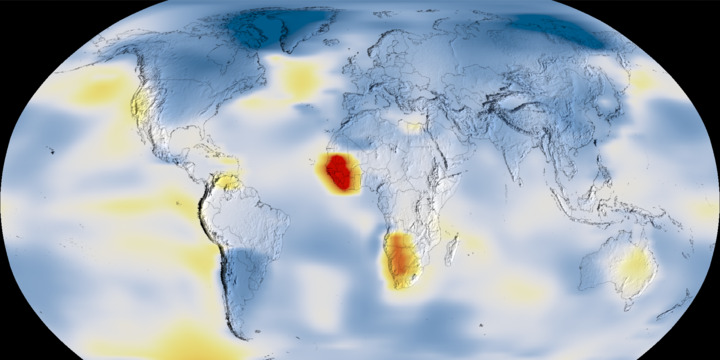
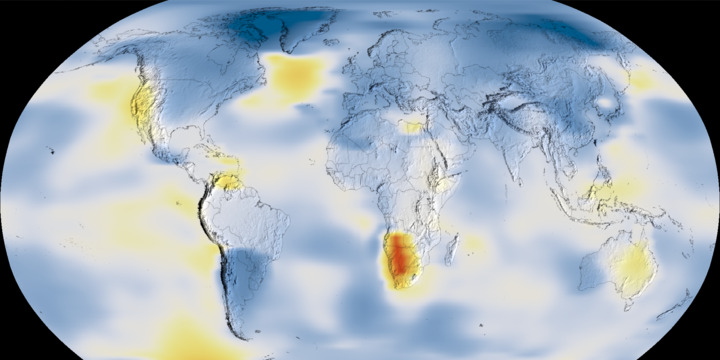
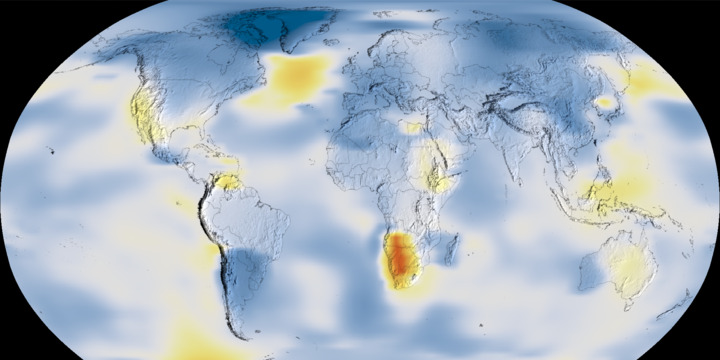
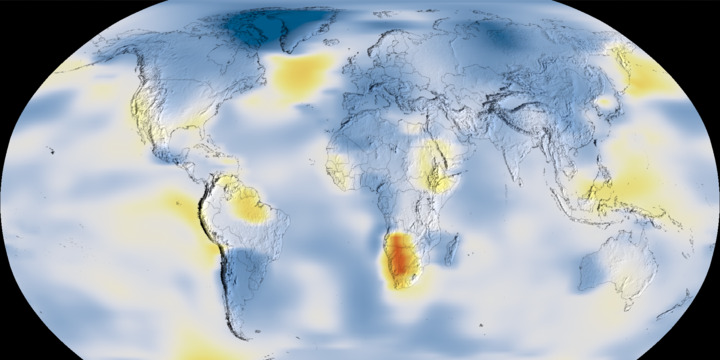
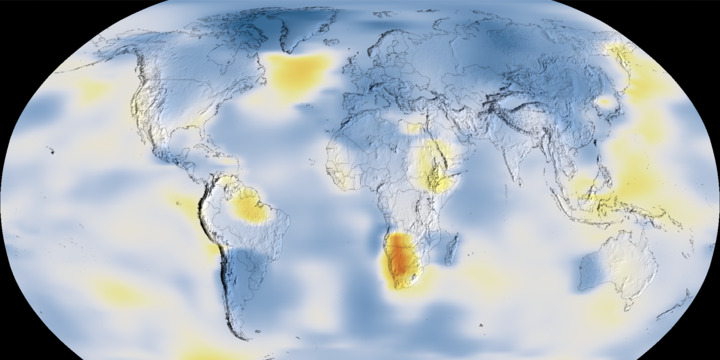
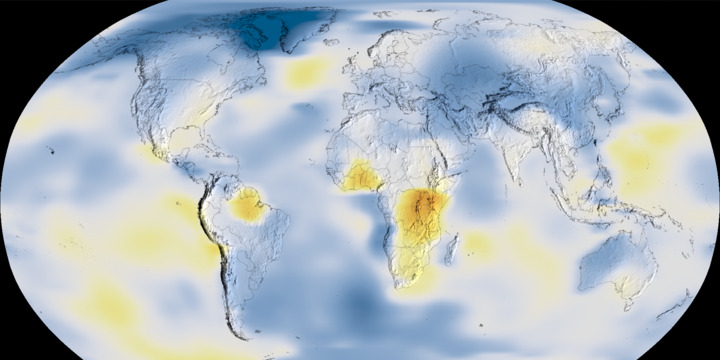
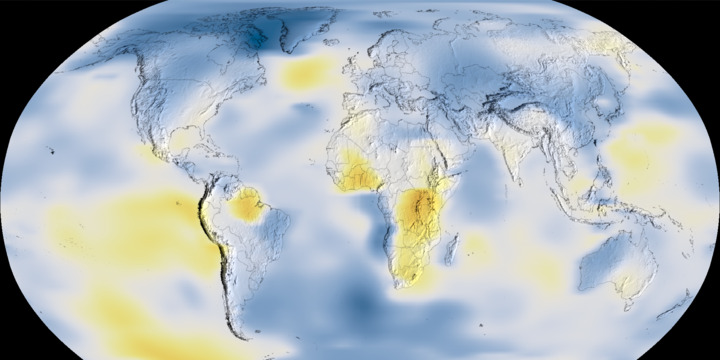
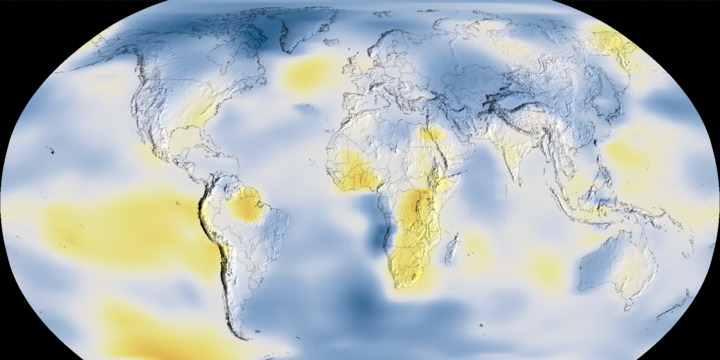
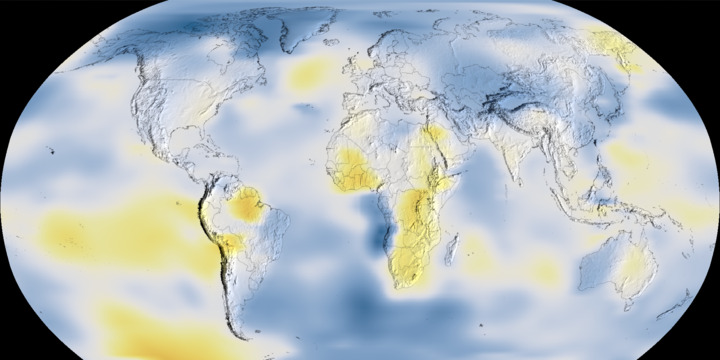
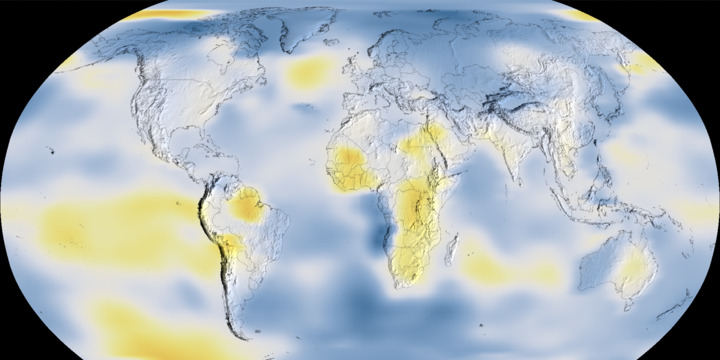
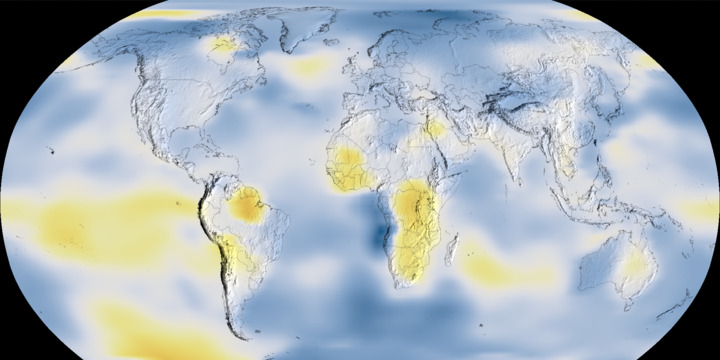
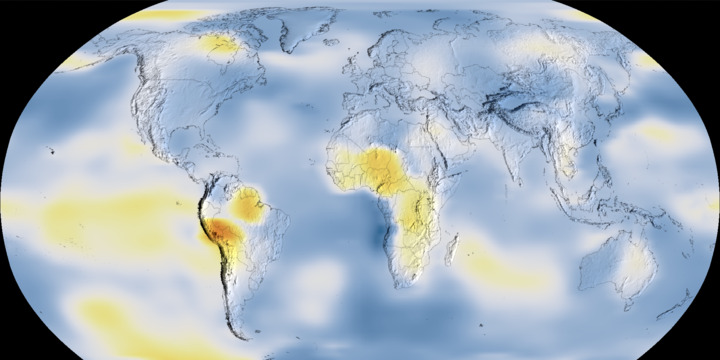
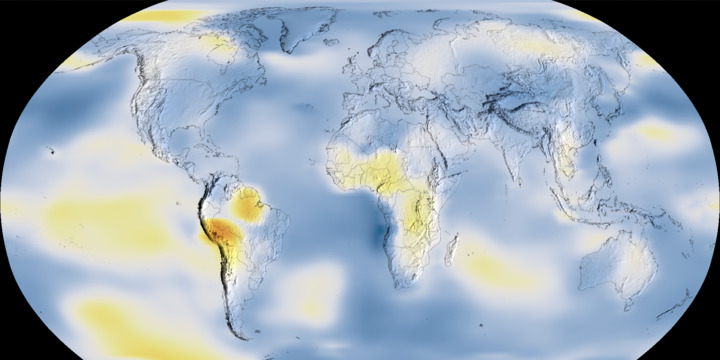
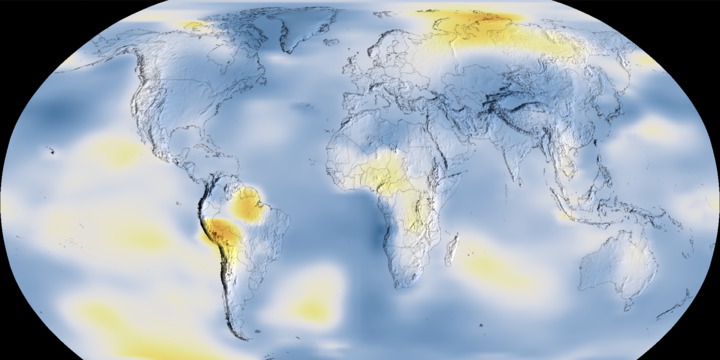
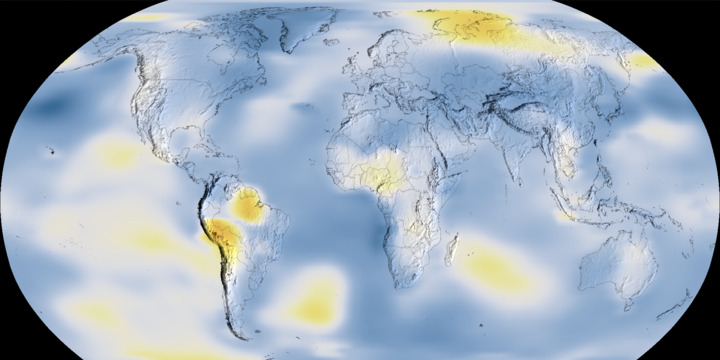
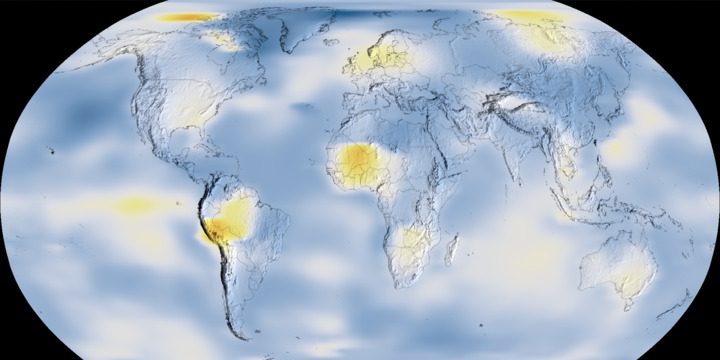
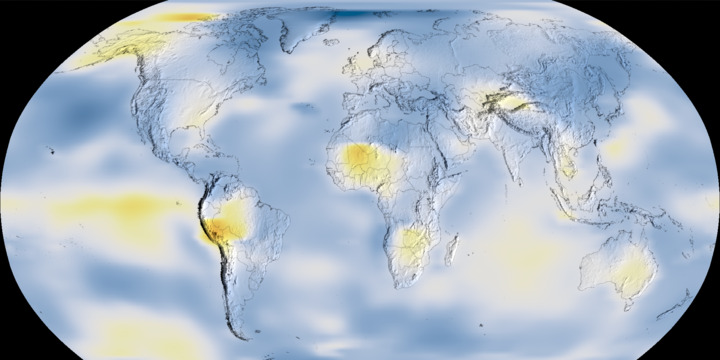
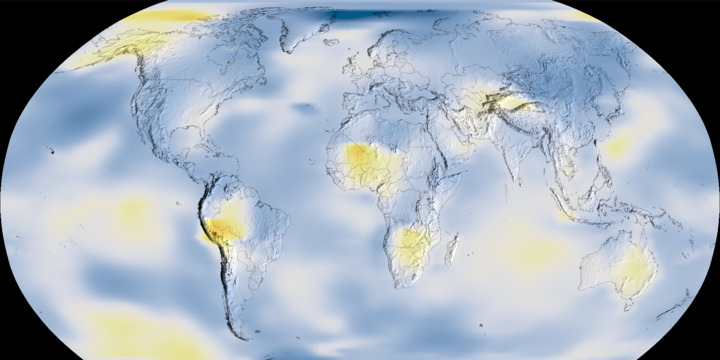
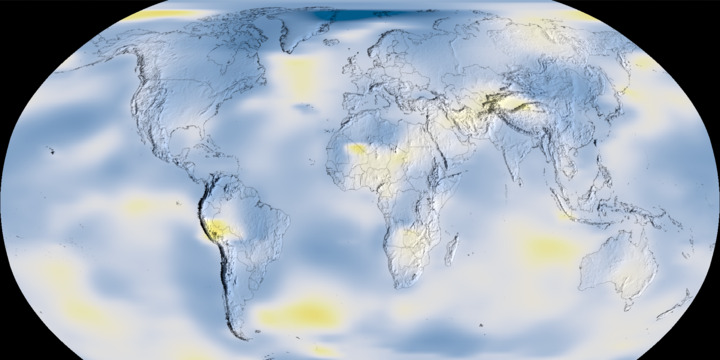
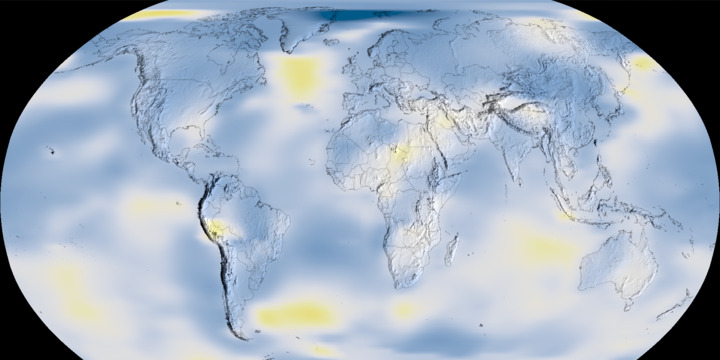
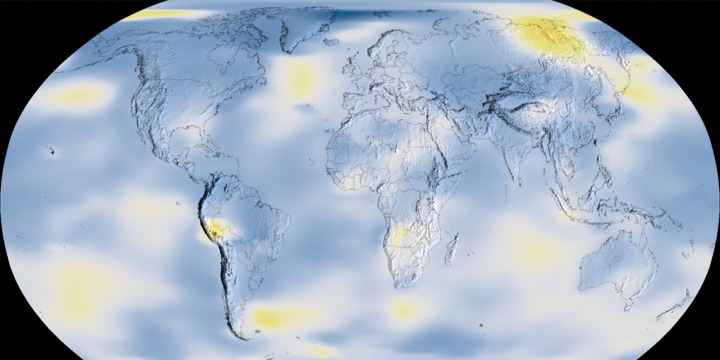
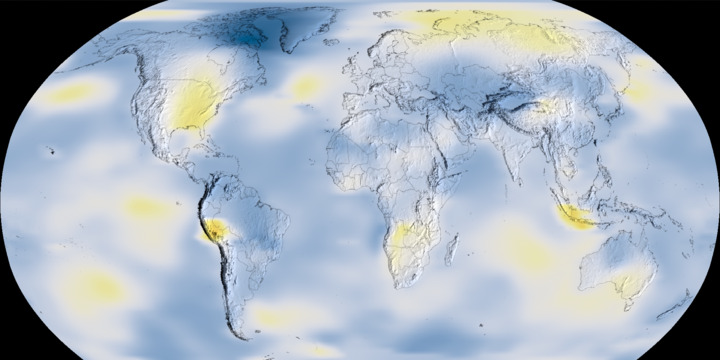
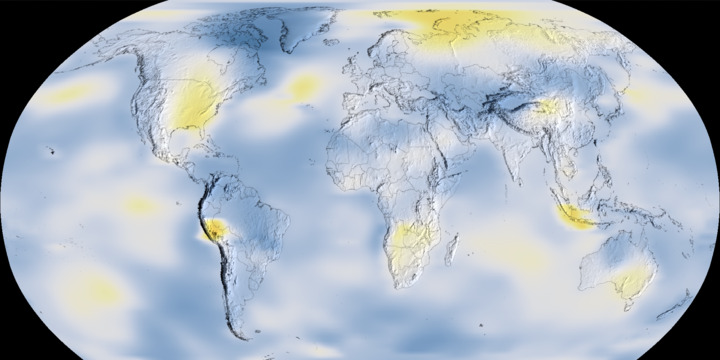
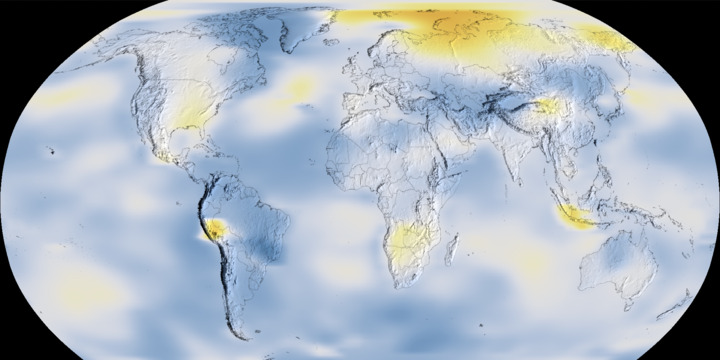
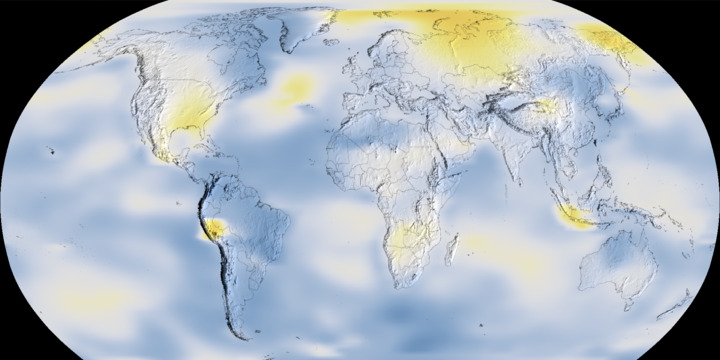
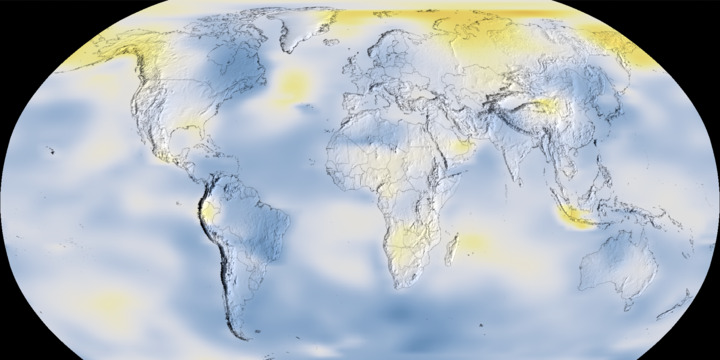
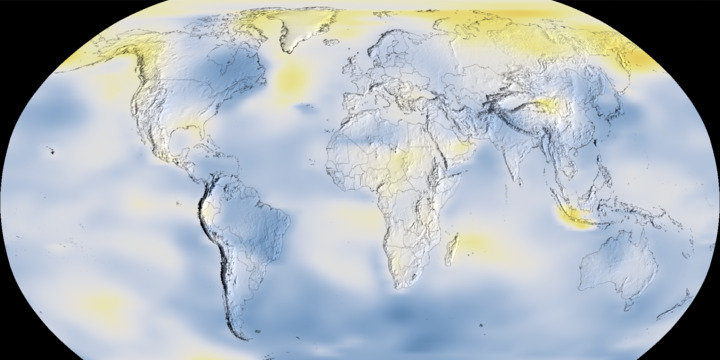
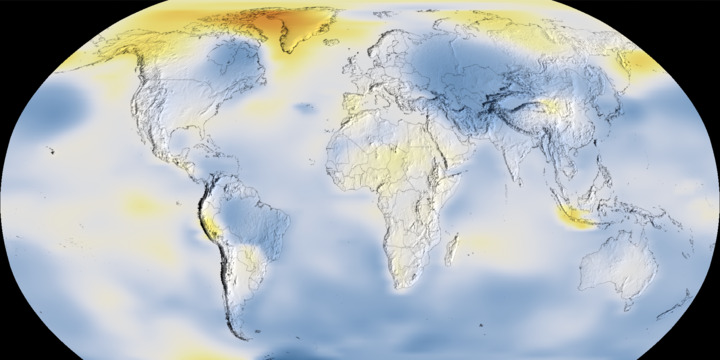
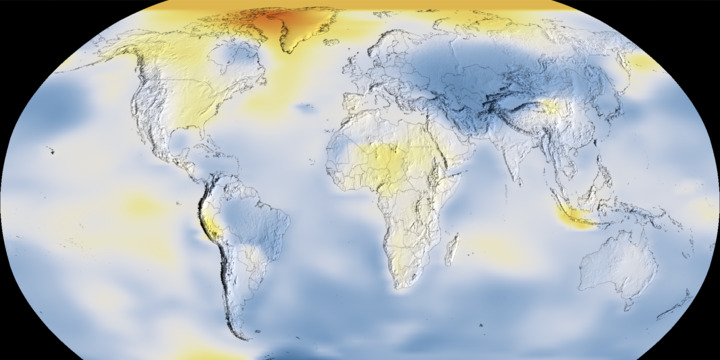
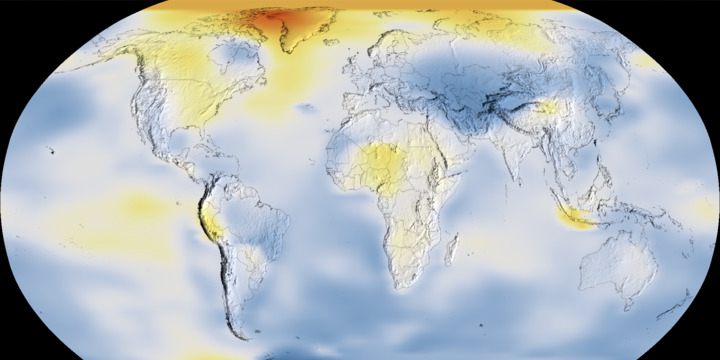
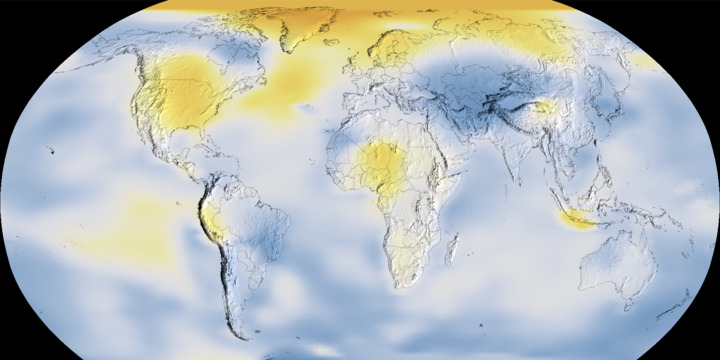
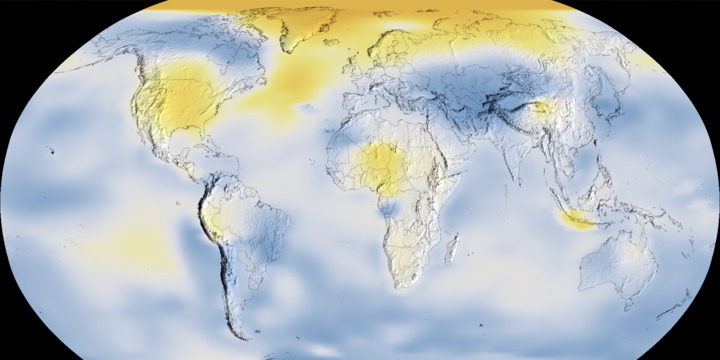
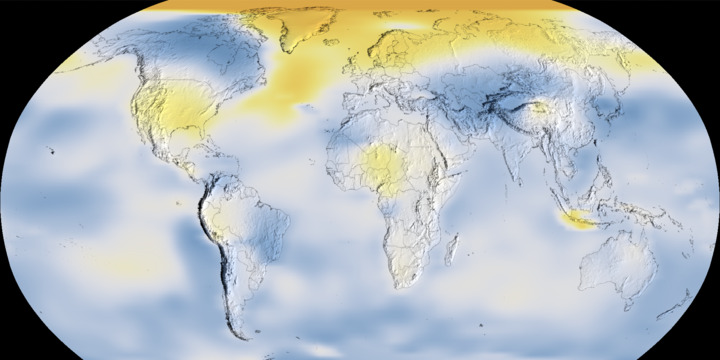
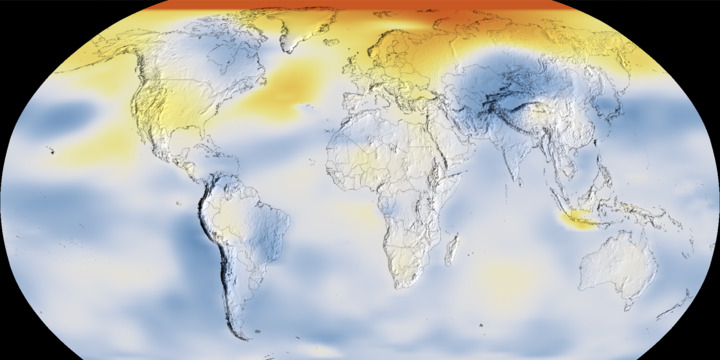
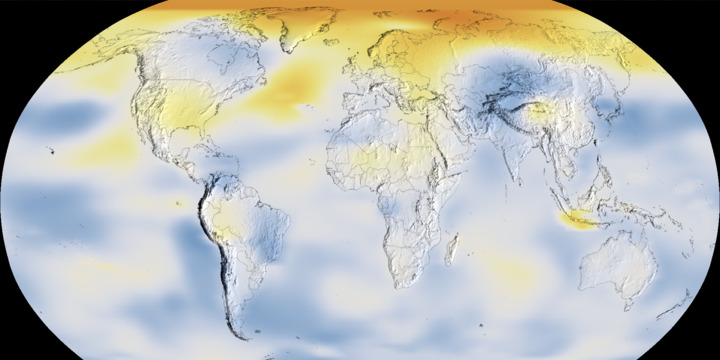
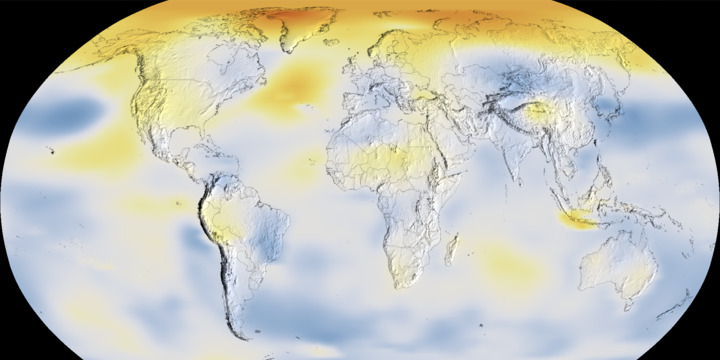
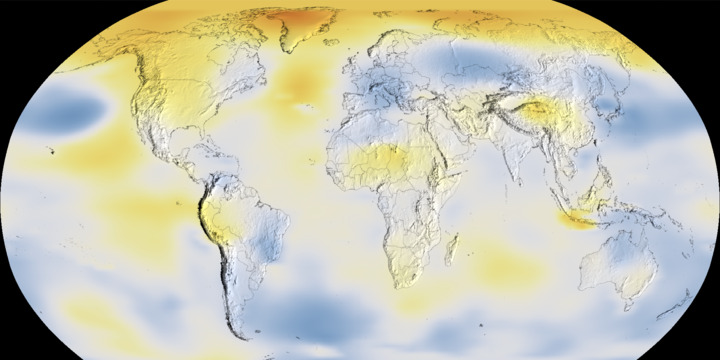
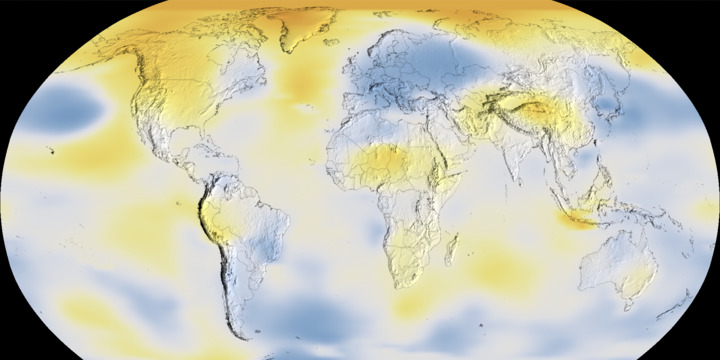
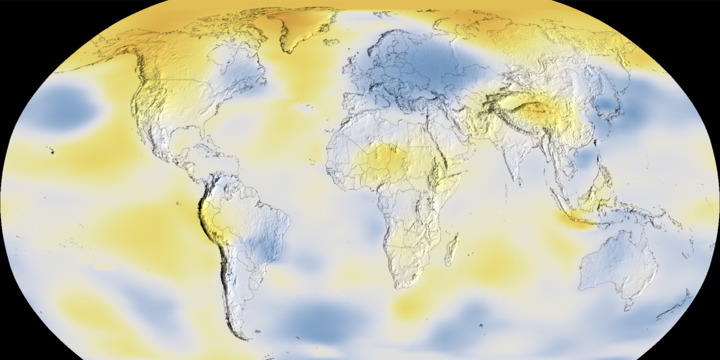
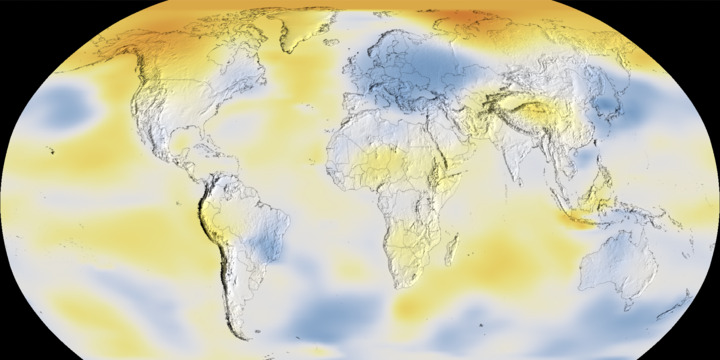
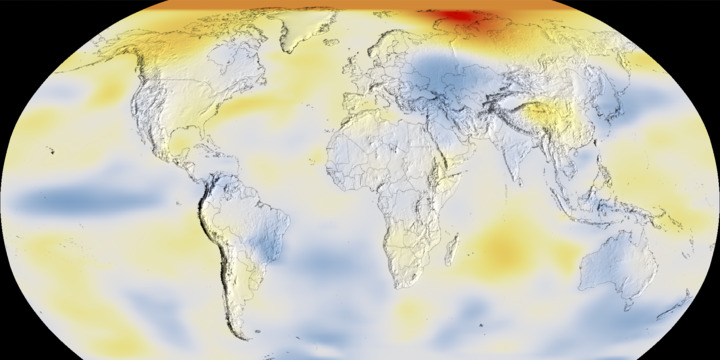
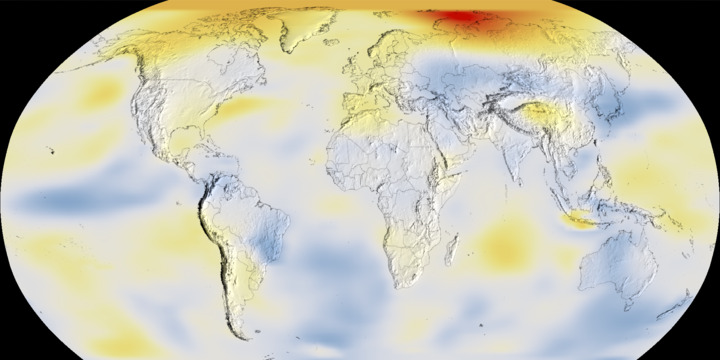
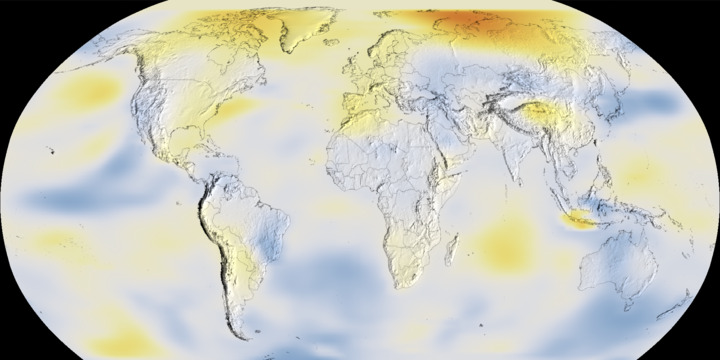
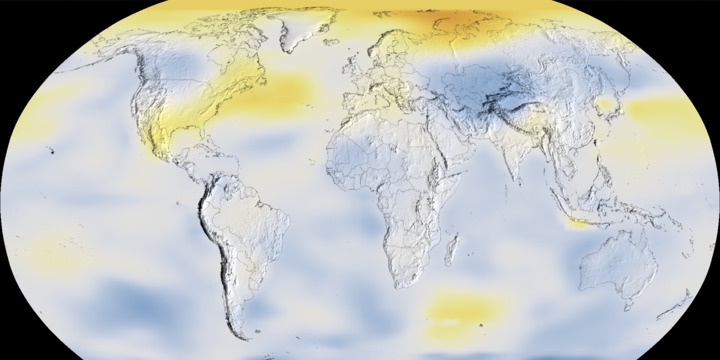
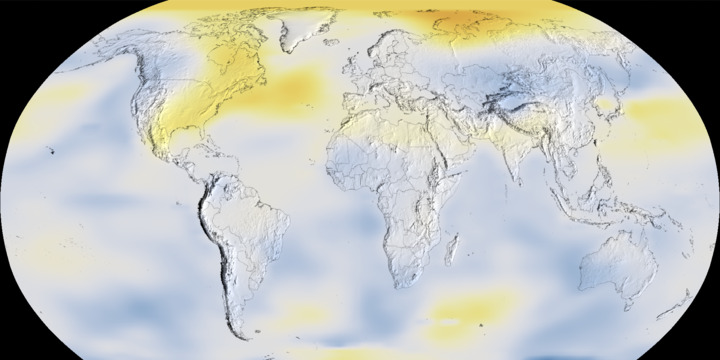
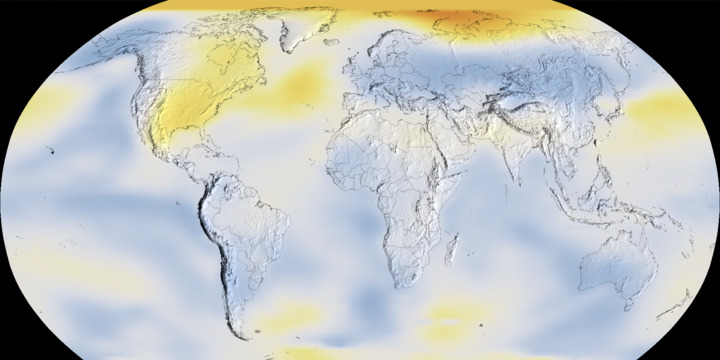
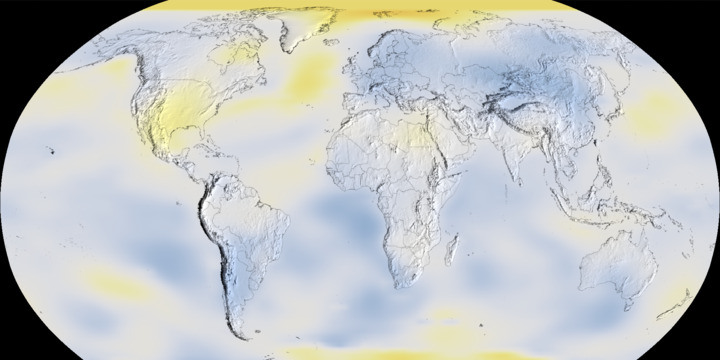
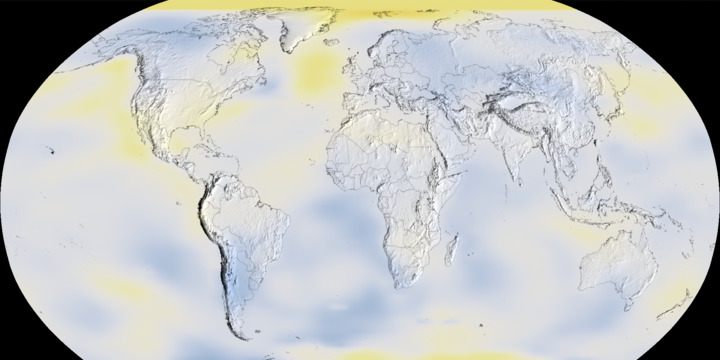
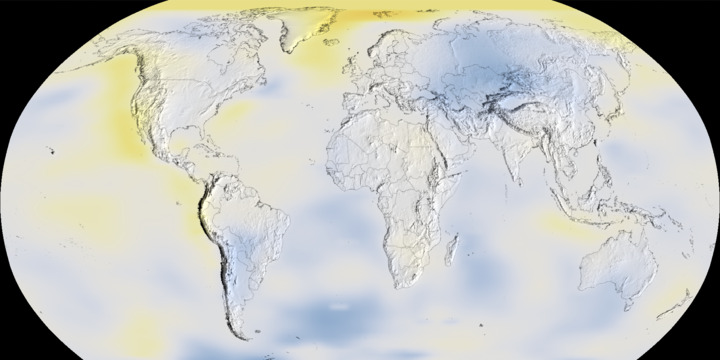
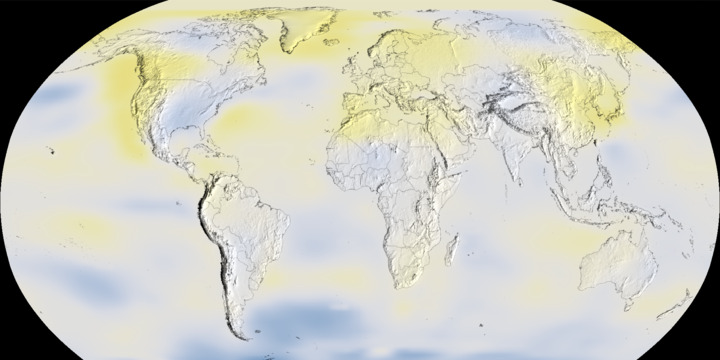
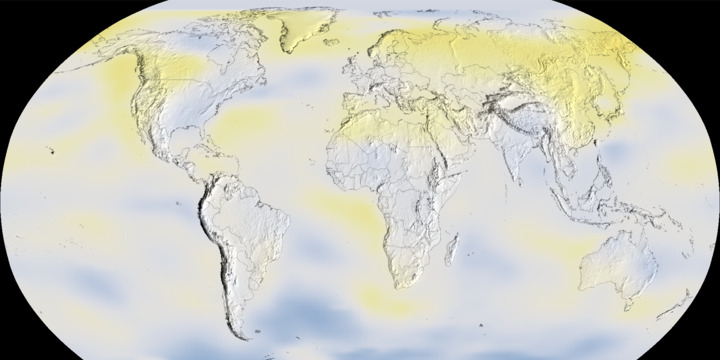
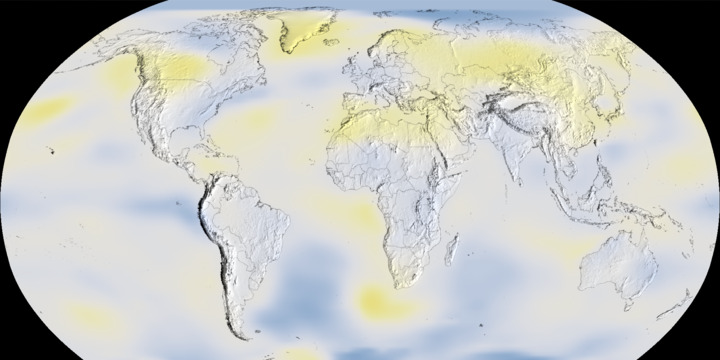
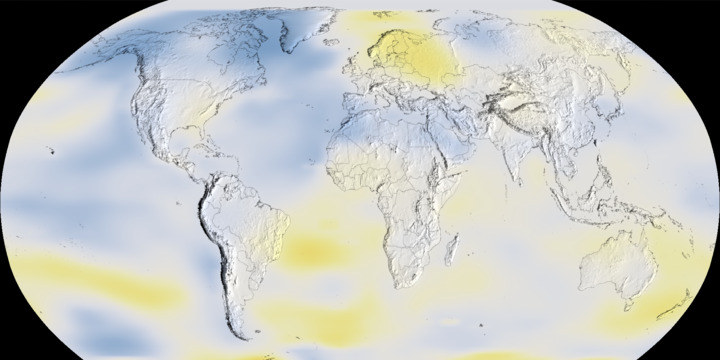
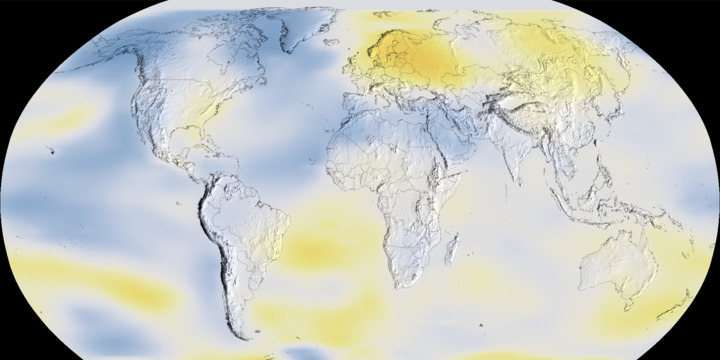
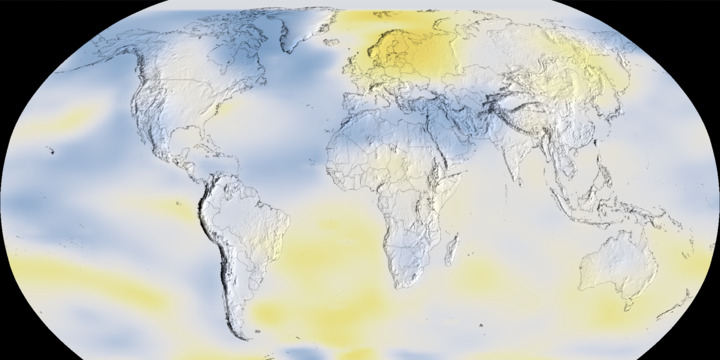
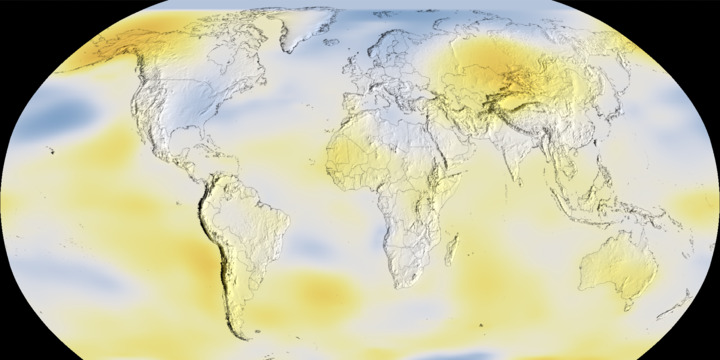
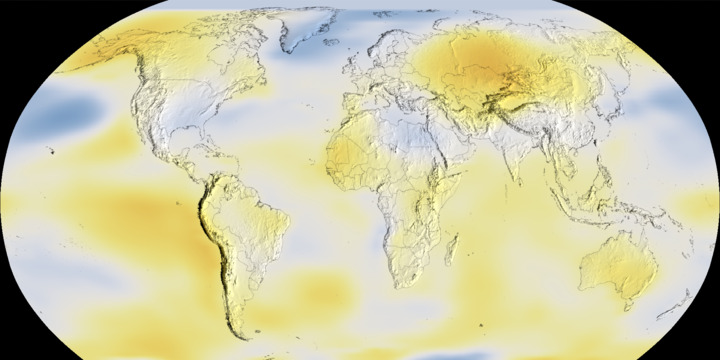
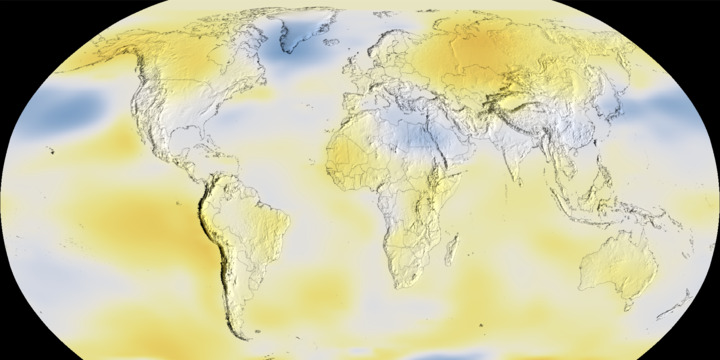
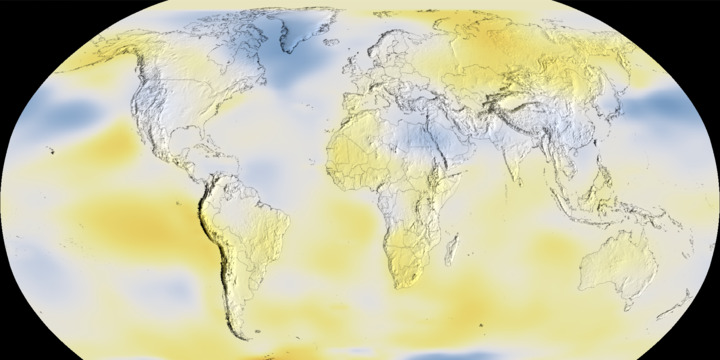
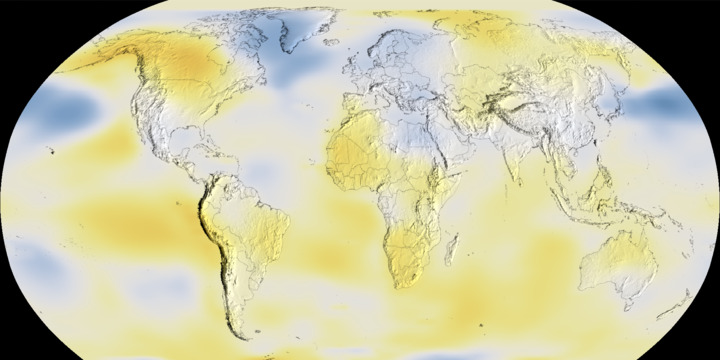
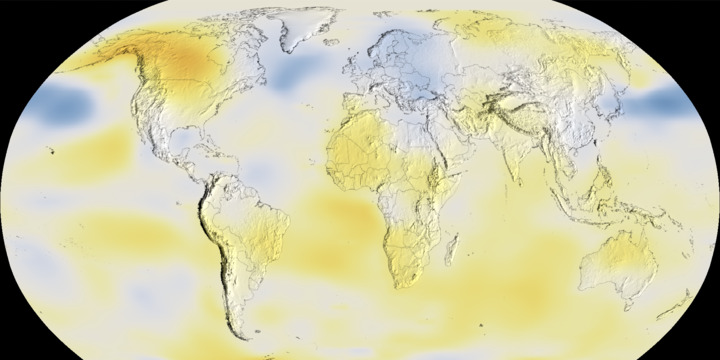
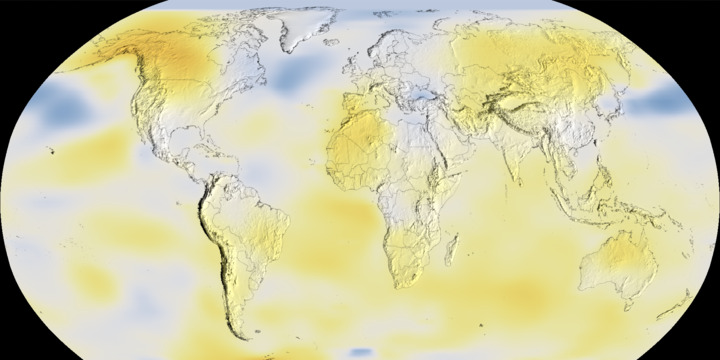
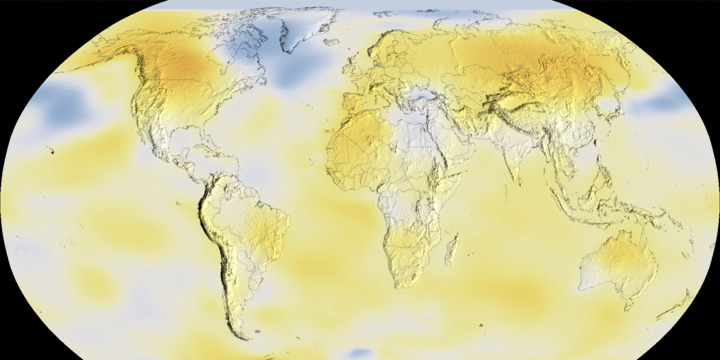
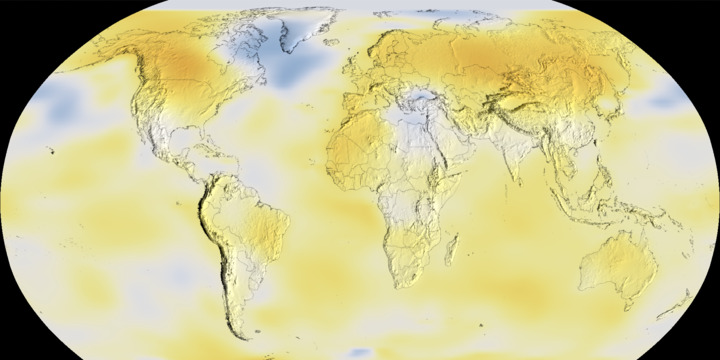
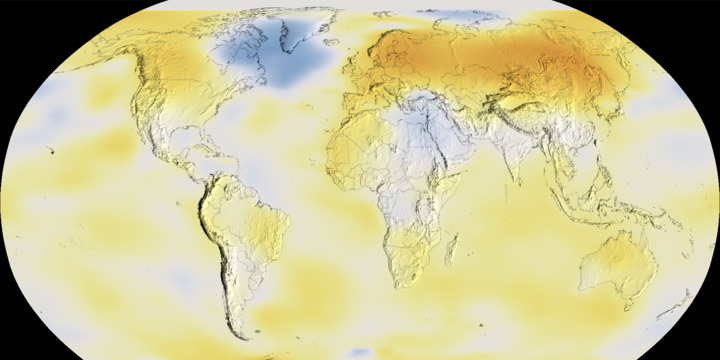
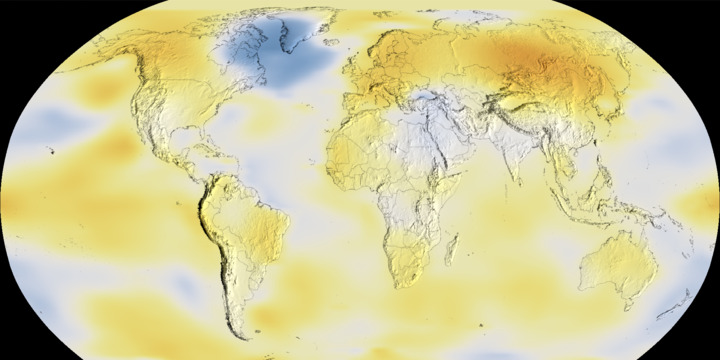
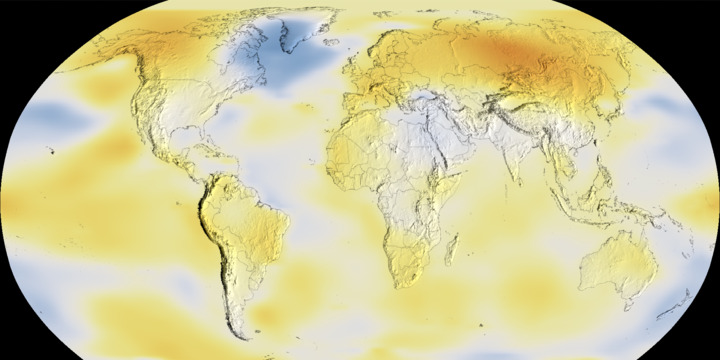
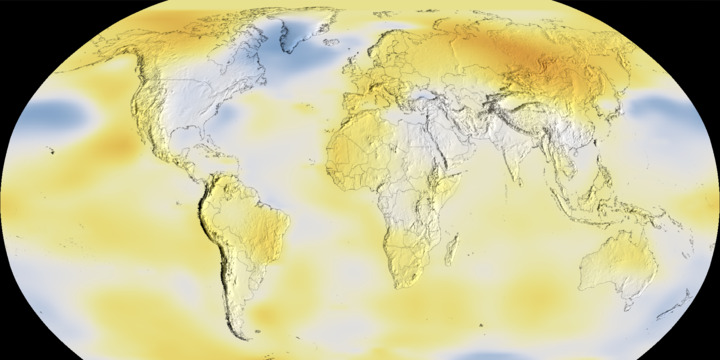
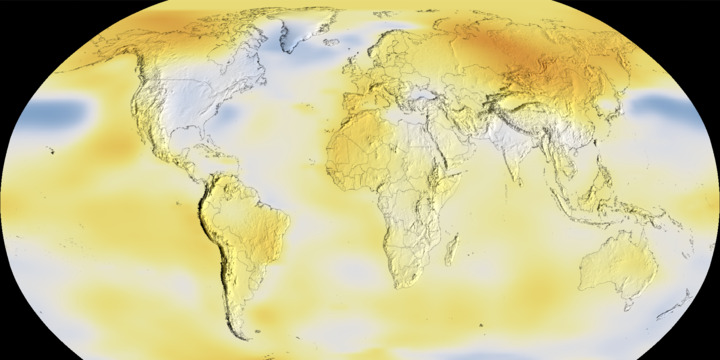
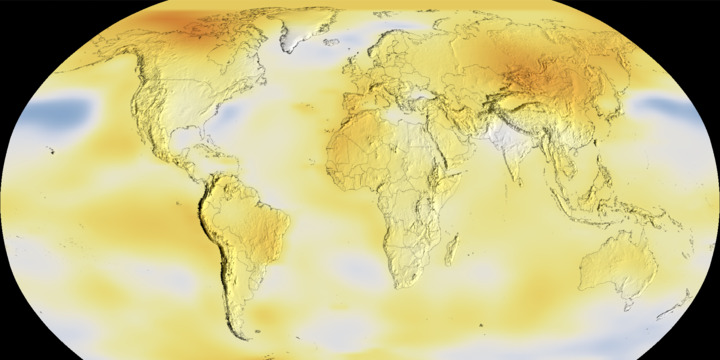
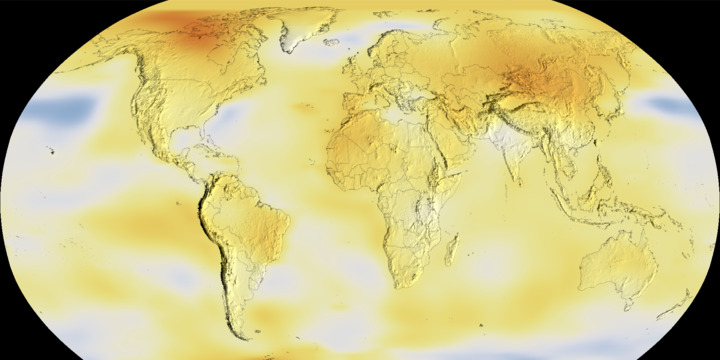
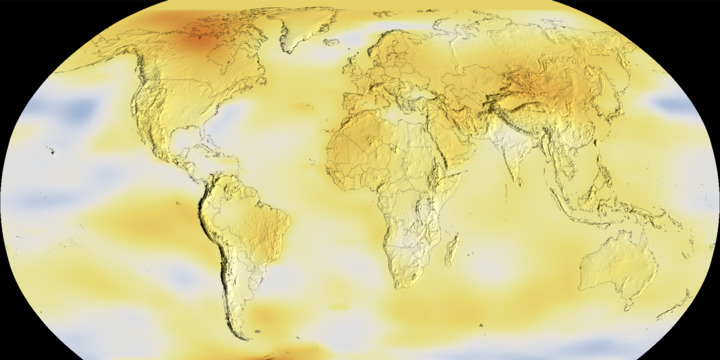
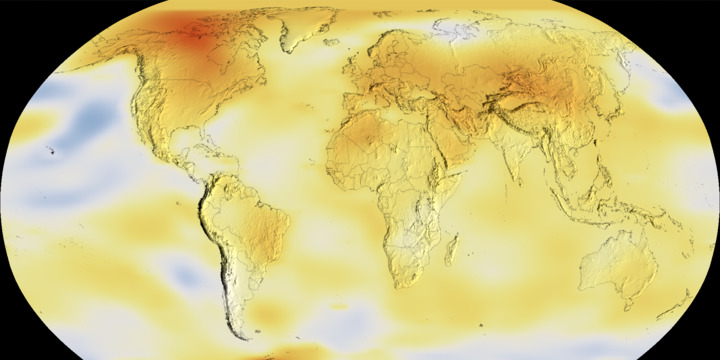
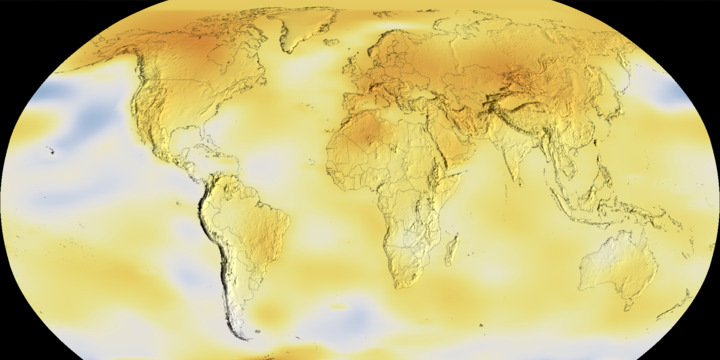
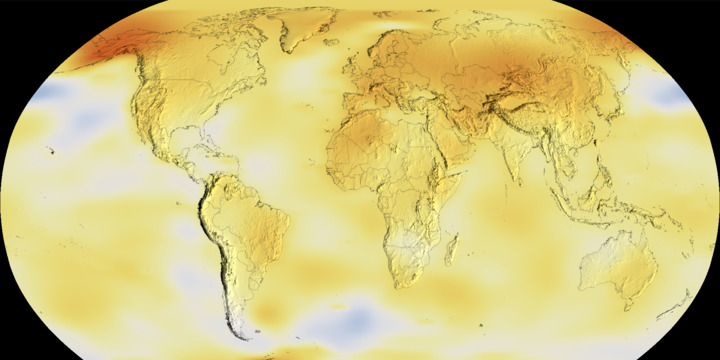
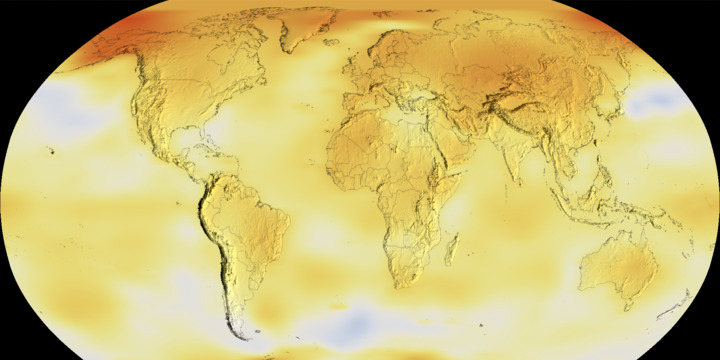
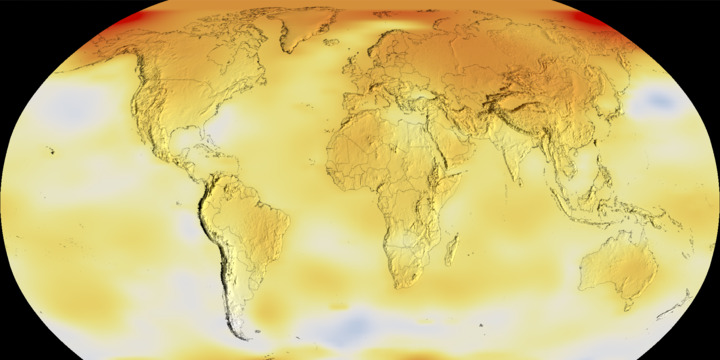
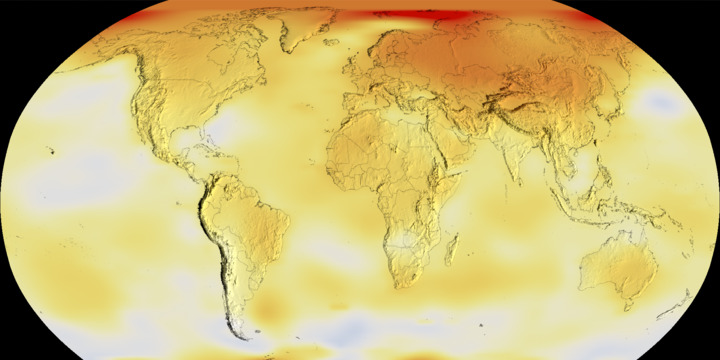
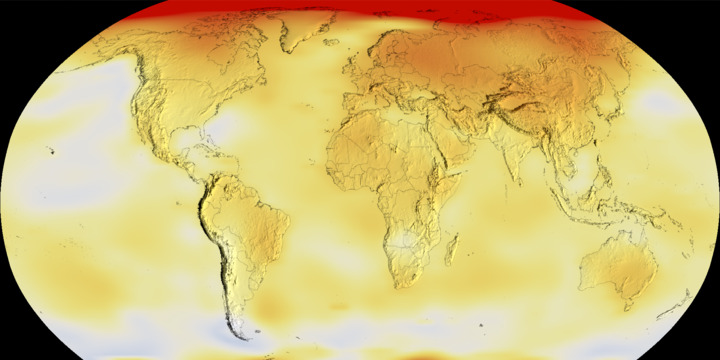
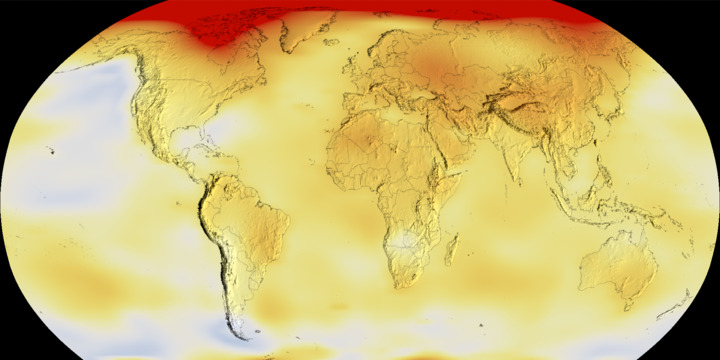
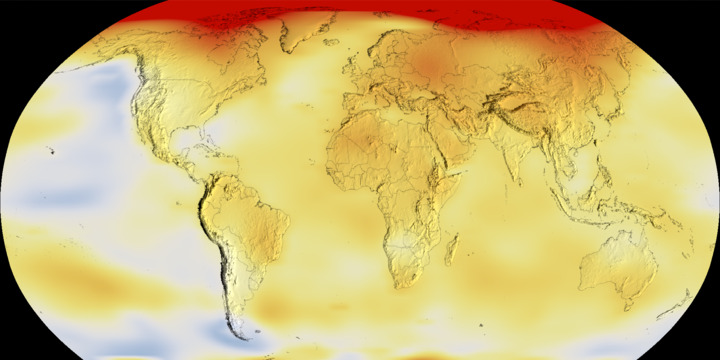
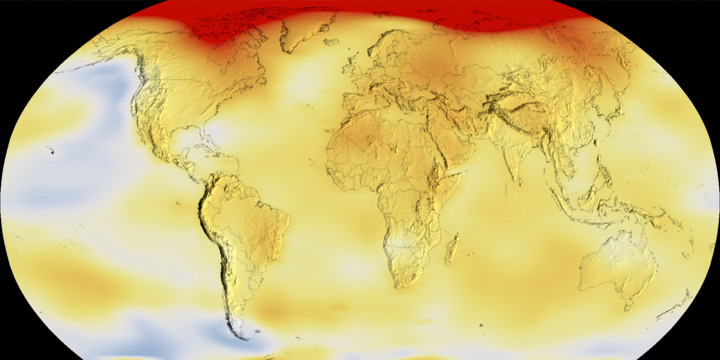
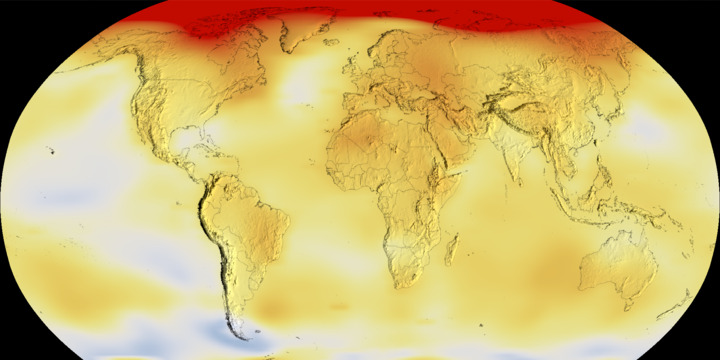
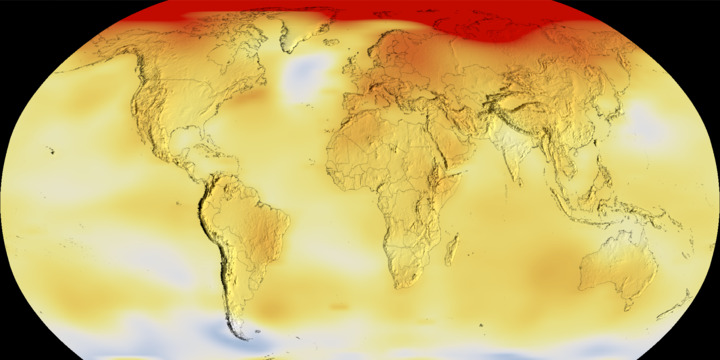
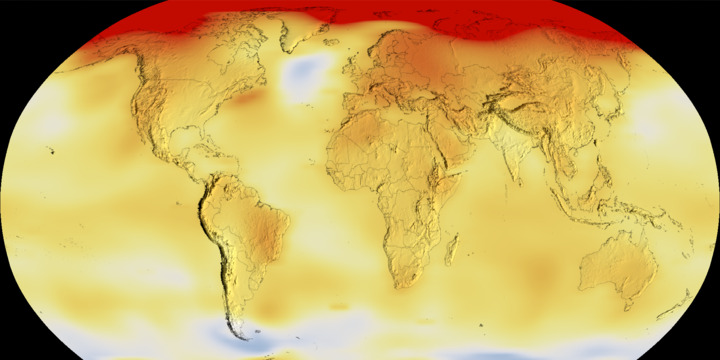
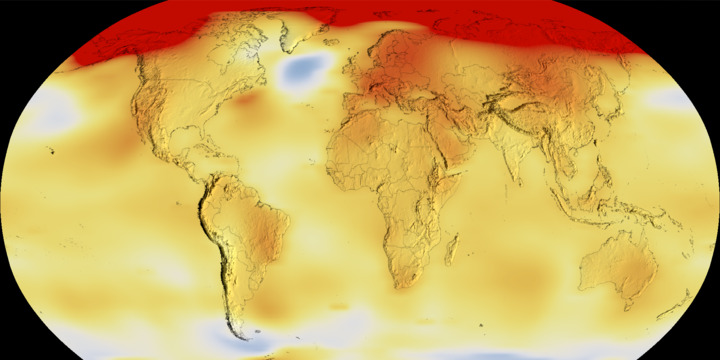
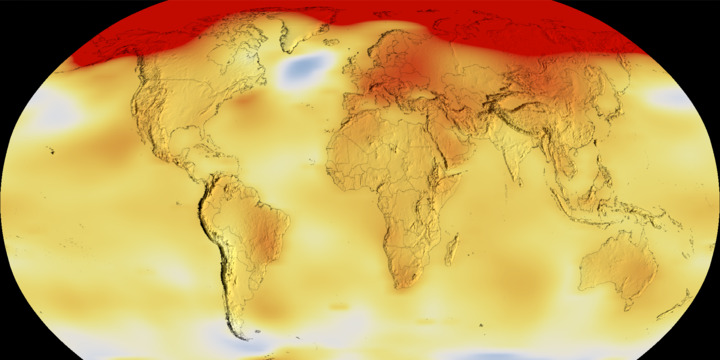
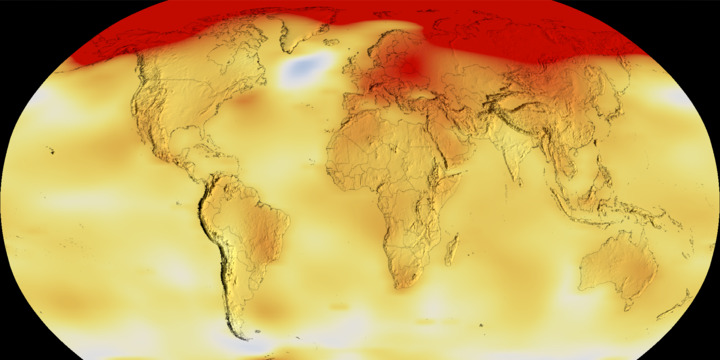
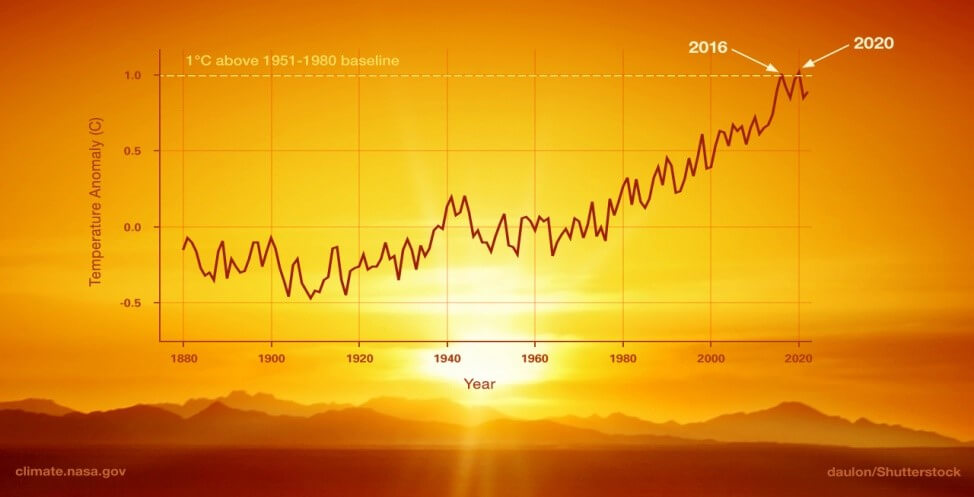
Global Temperature
Global temperature anomaly is how much warmer or colder than the long-term average a unit of time something is (like how much warmer than average the most recent year was globally).
The 10 most recent years are the warmest years on record.
Time Series: 1884 to 2022
Data source: NASA/GISS
Credit: NASA's Scientific Visualization Studio
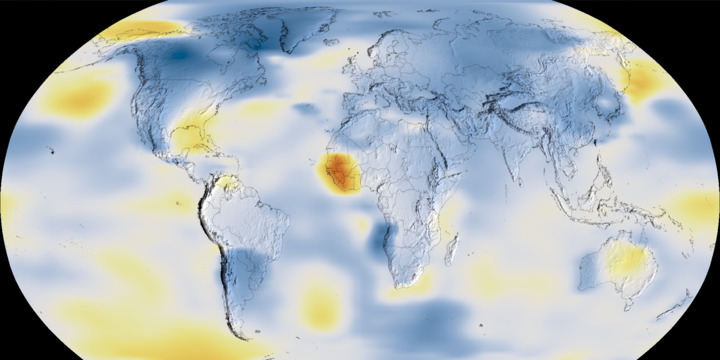

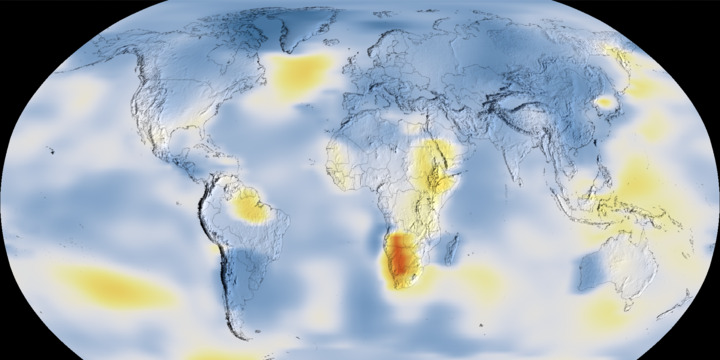
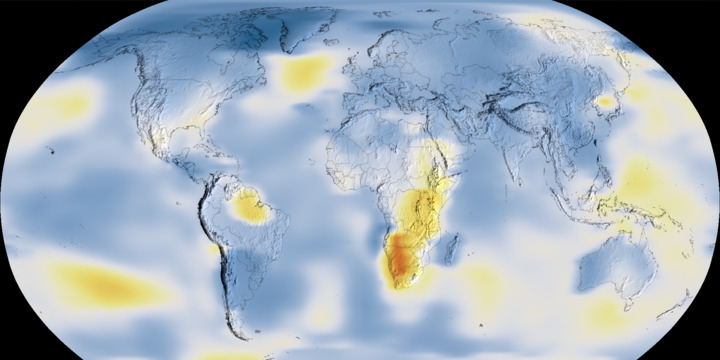
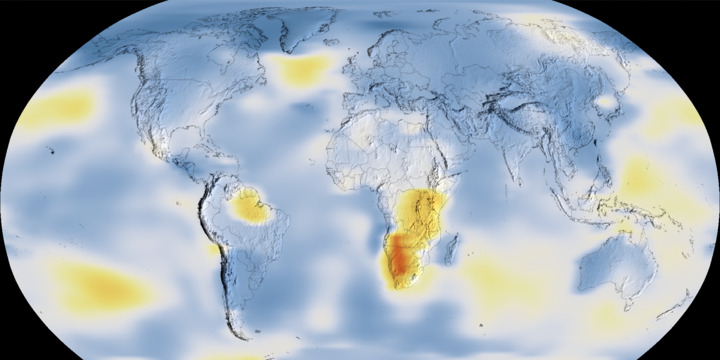
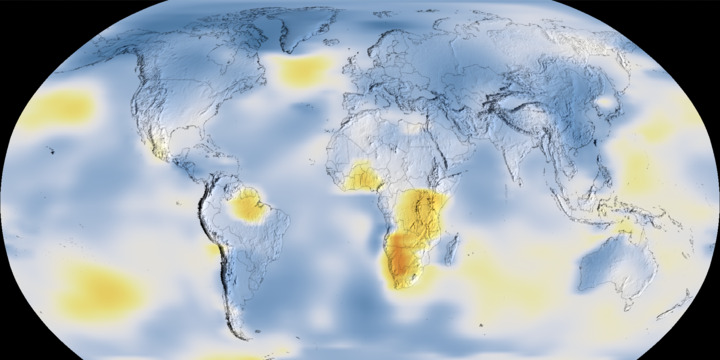
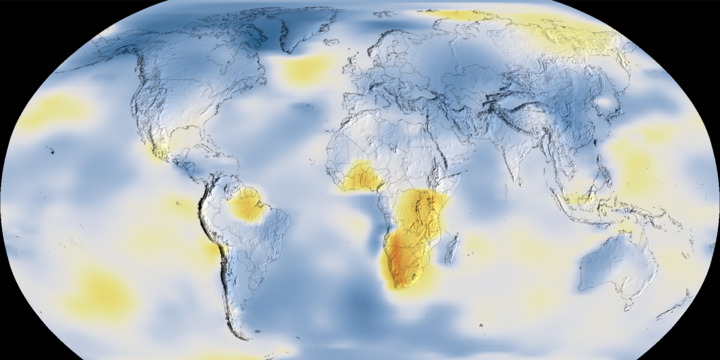
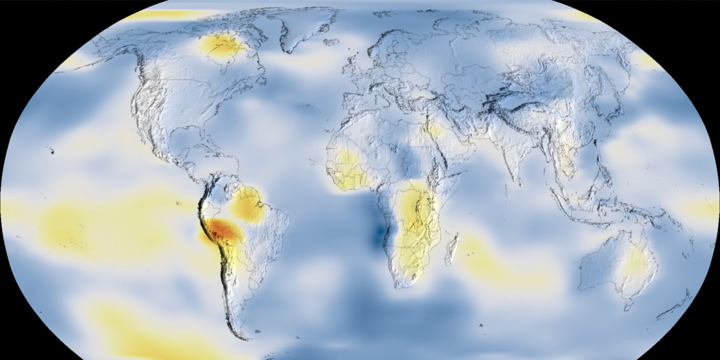
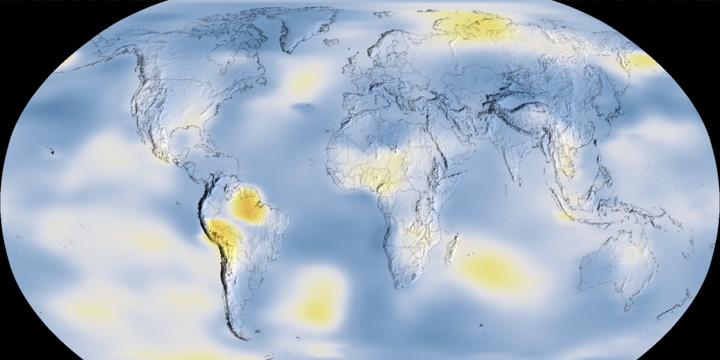
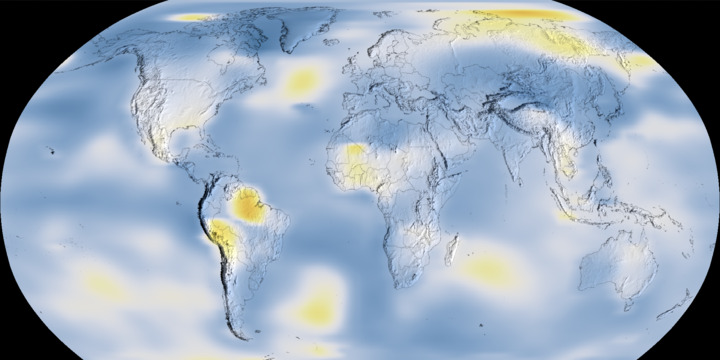
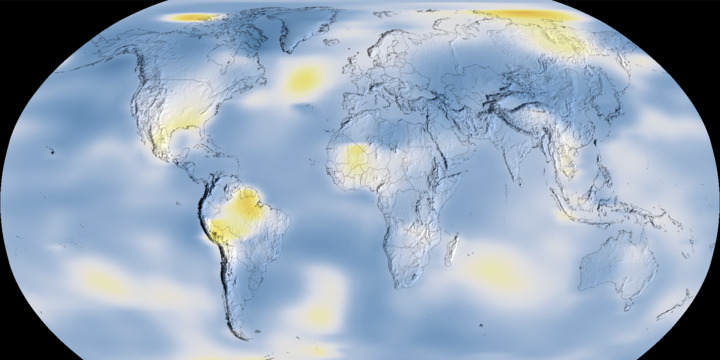
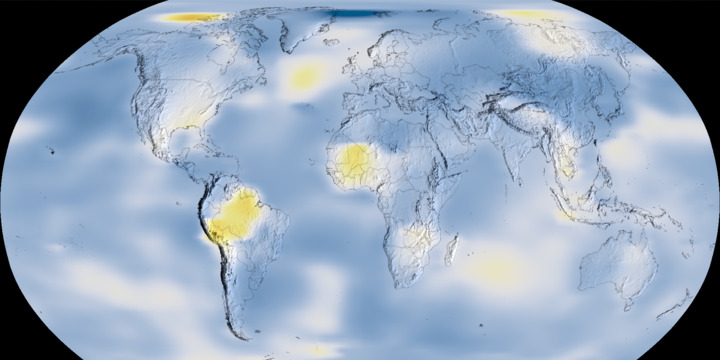
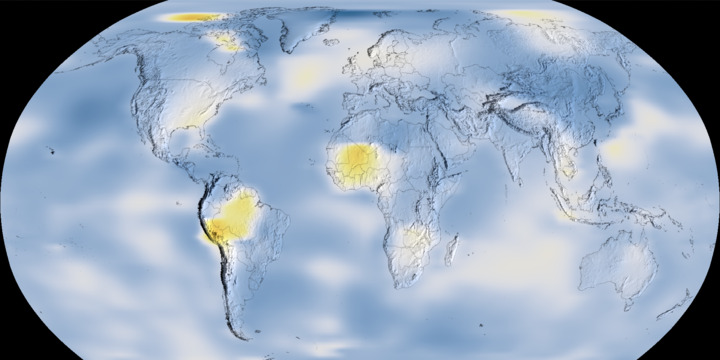
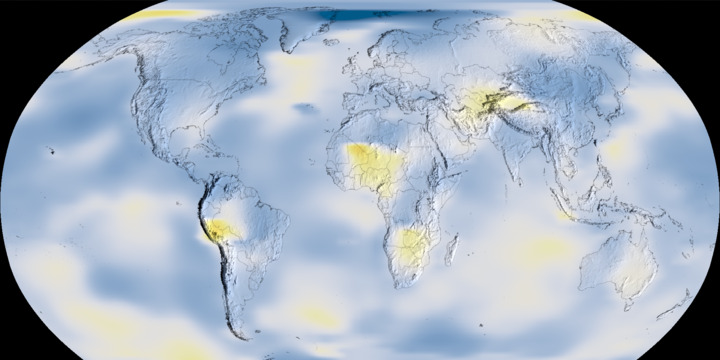
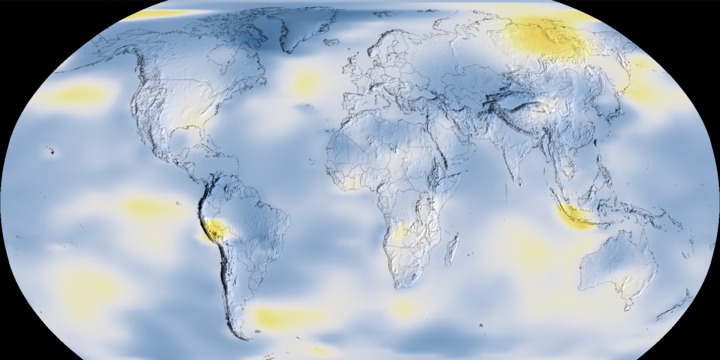
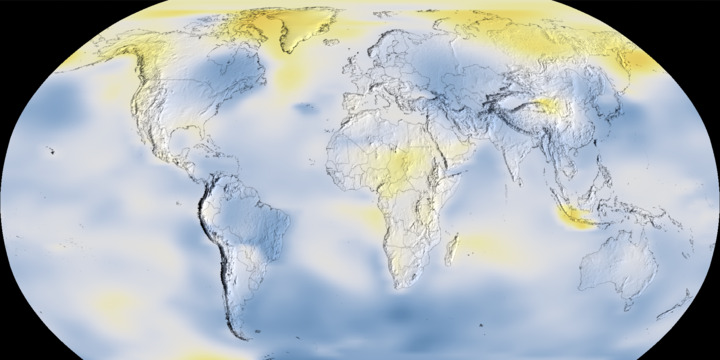
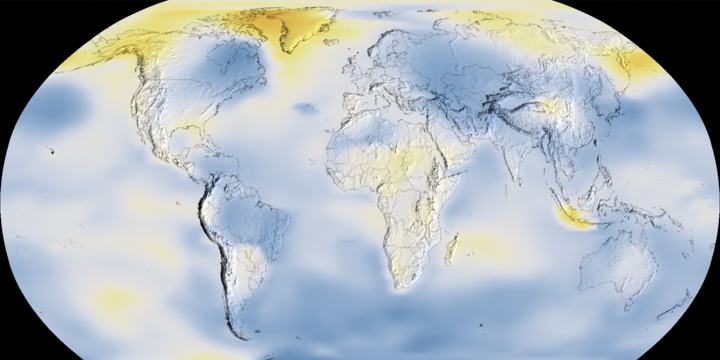
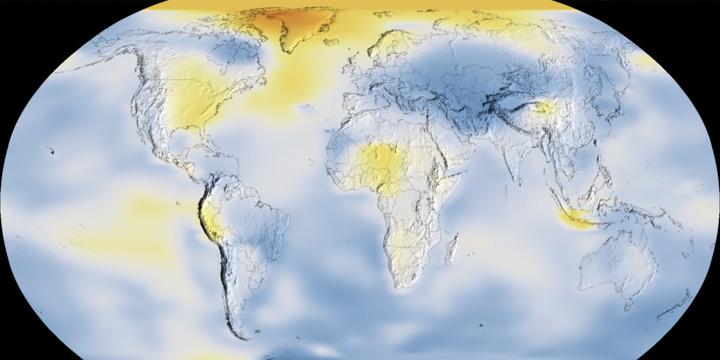
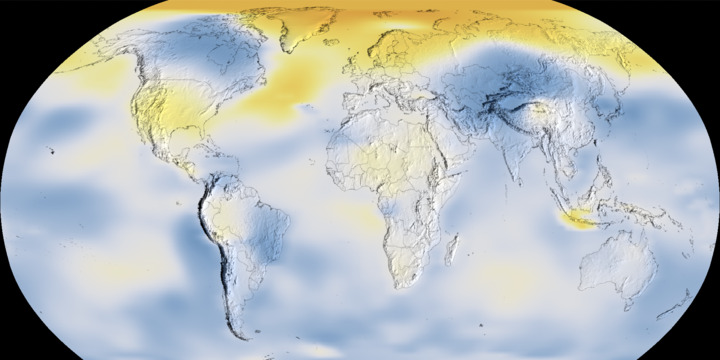
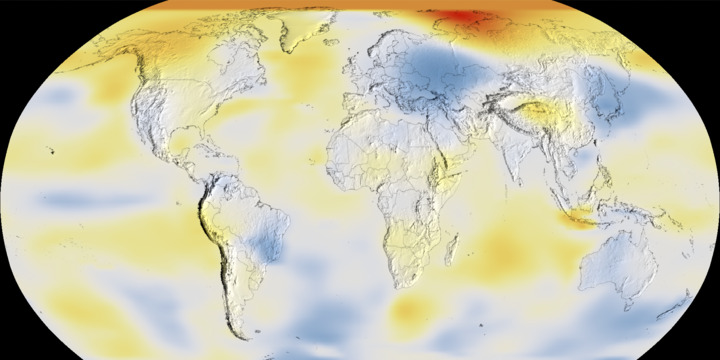
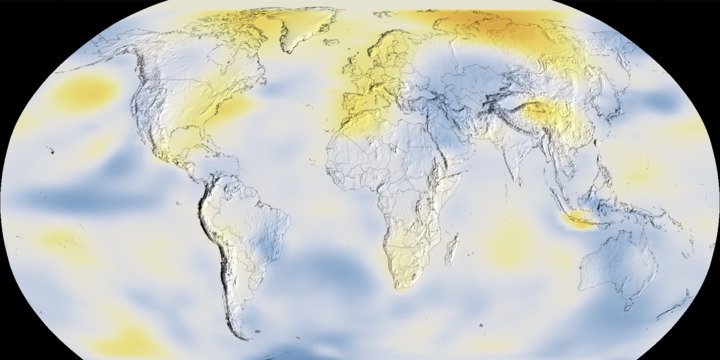
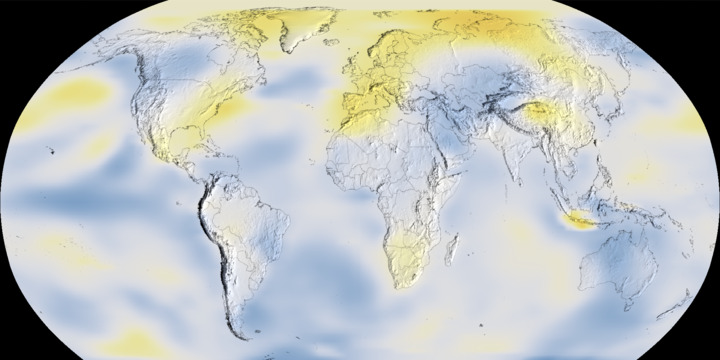
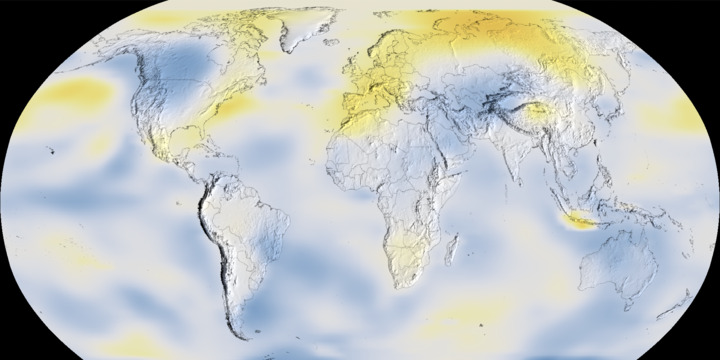
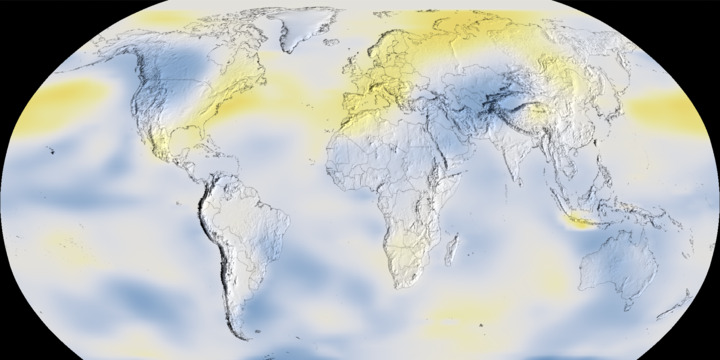
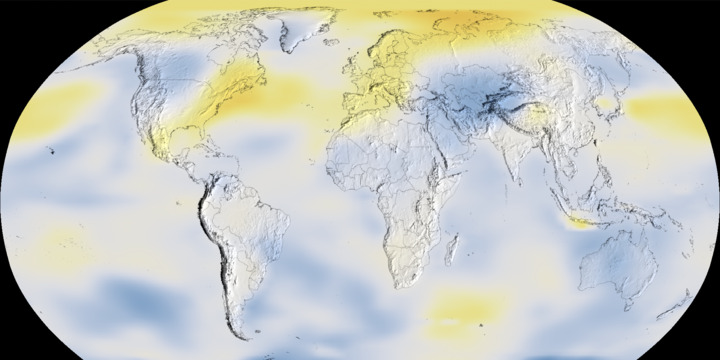
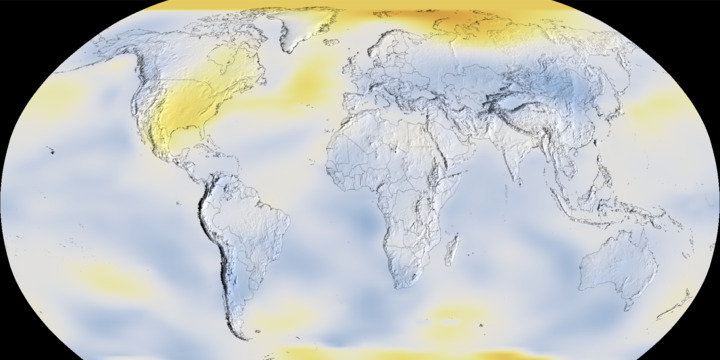
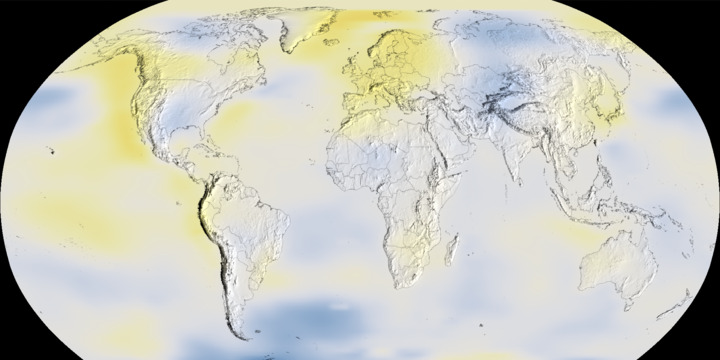
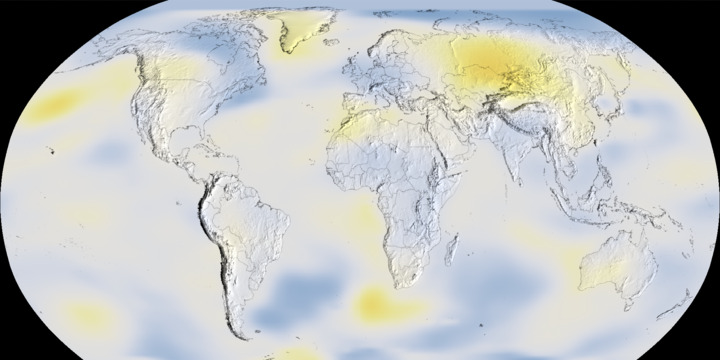
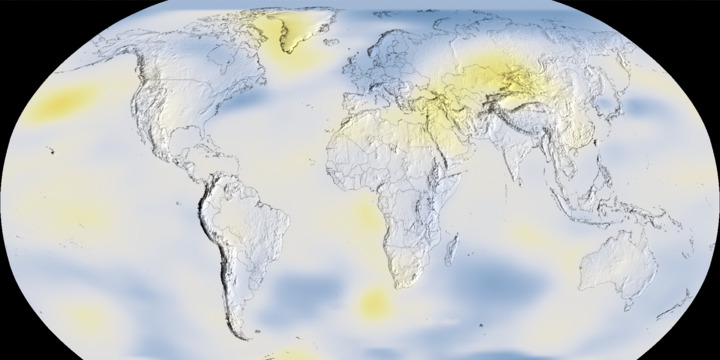
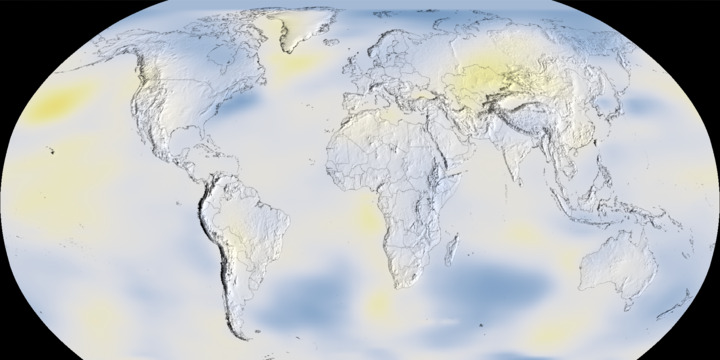
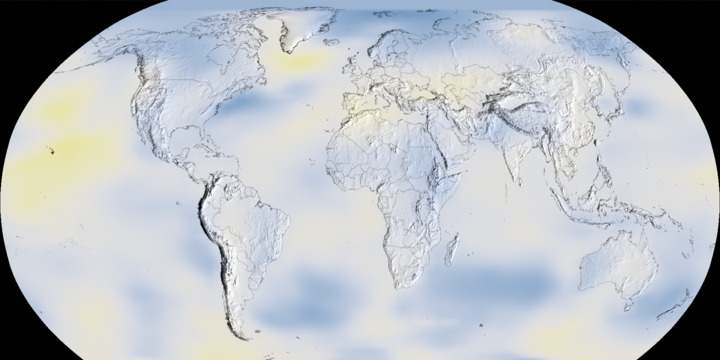
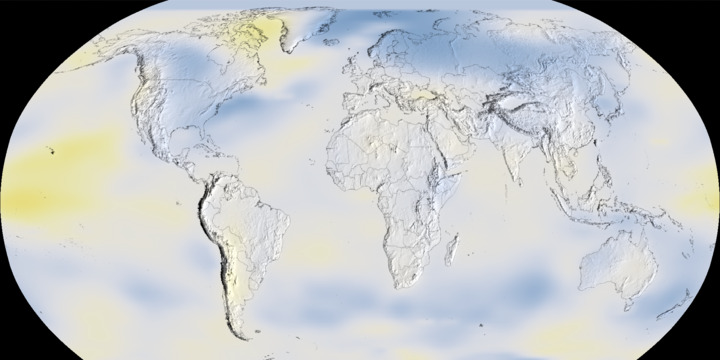
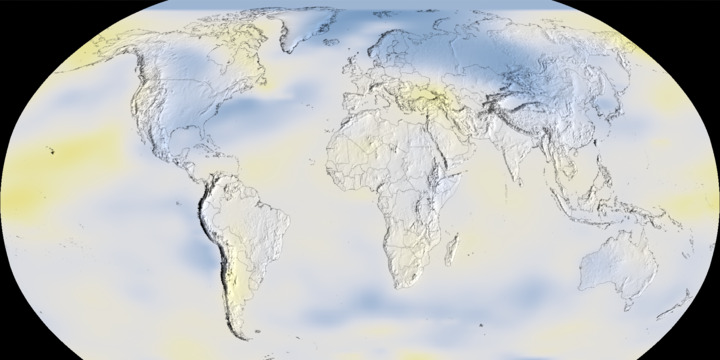
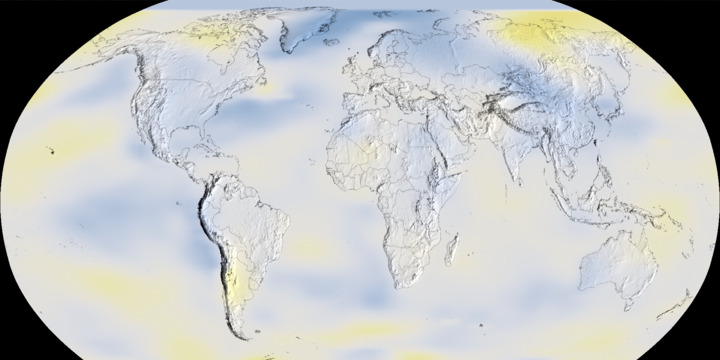
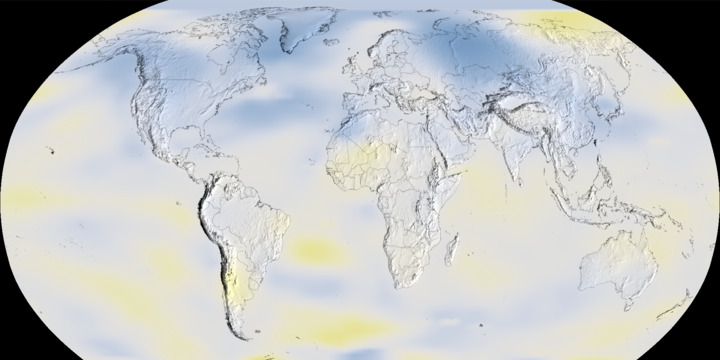
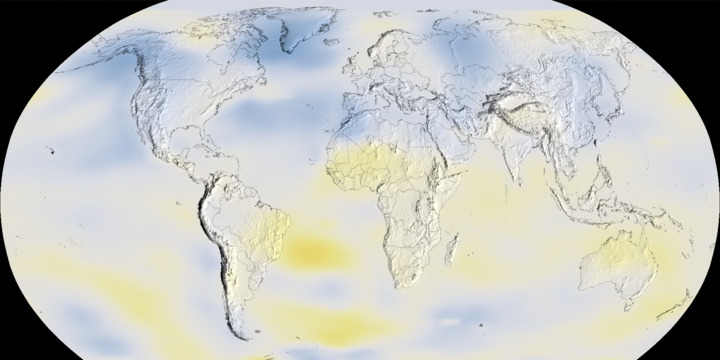
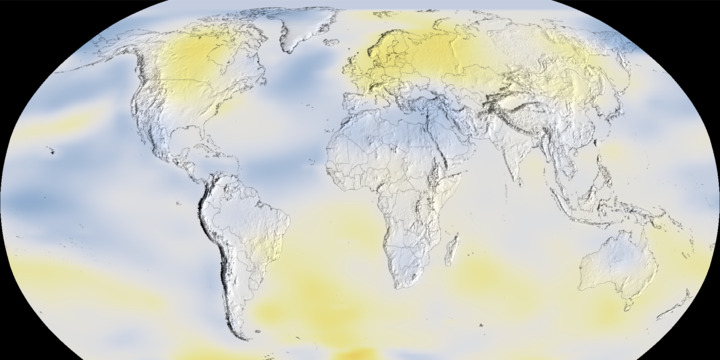
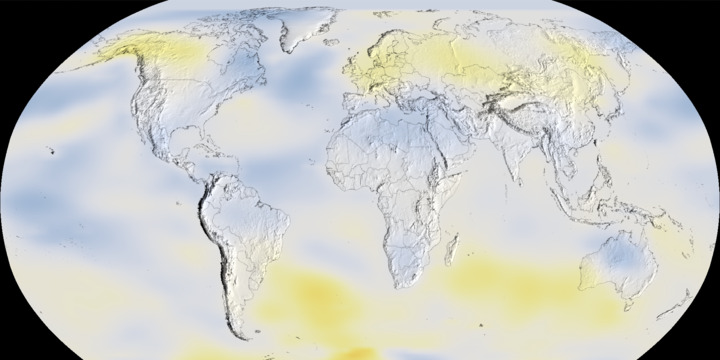
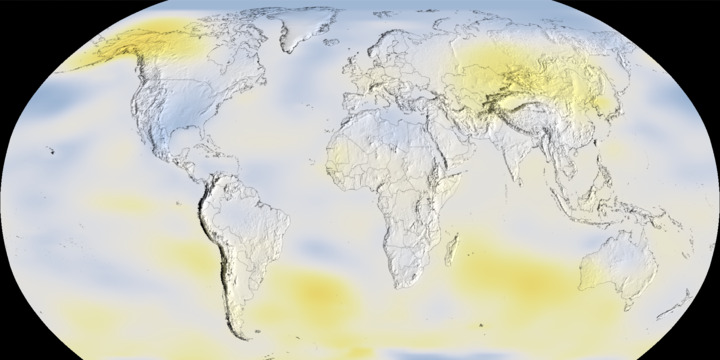
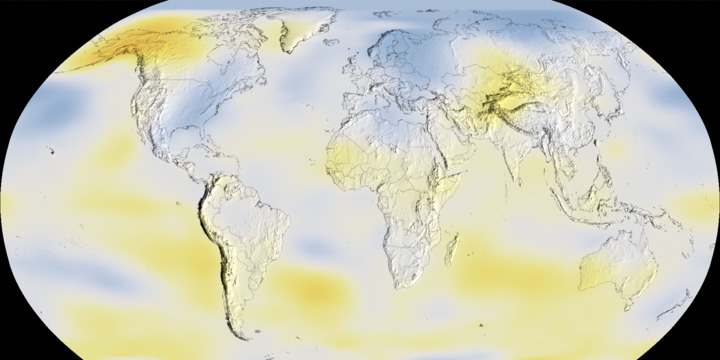
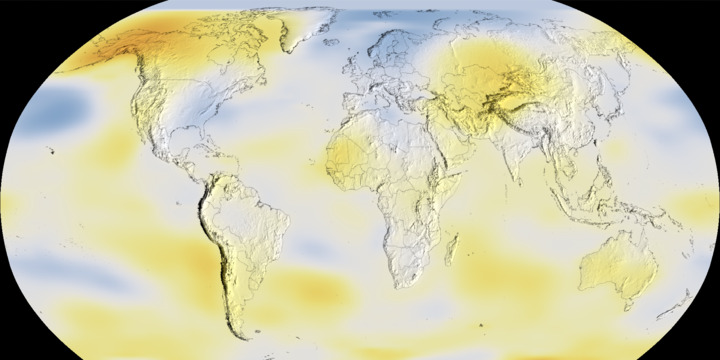
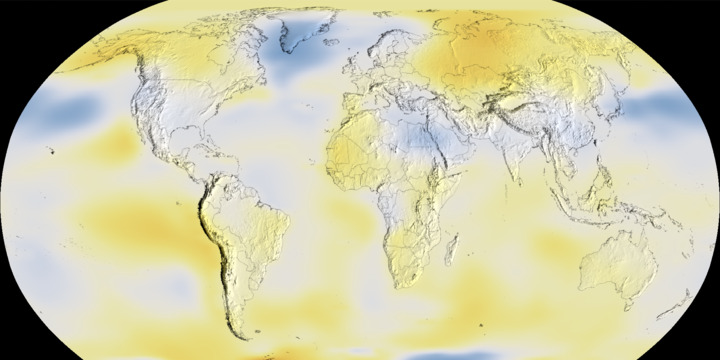
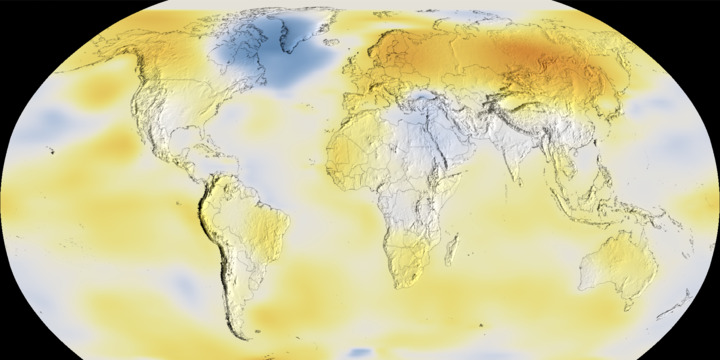
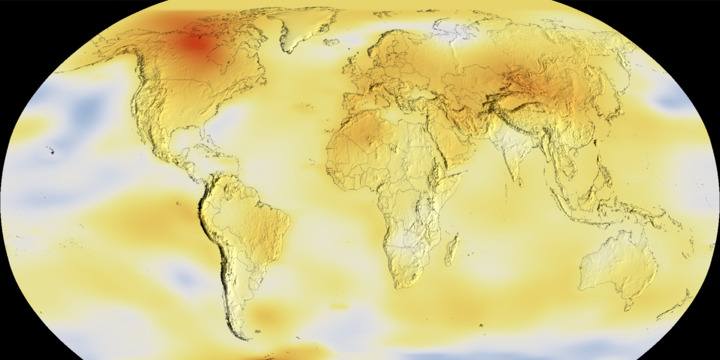
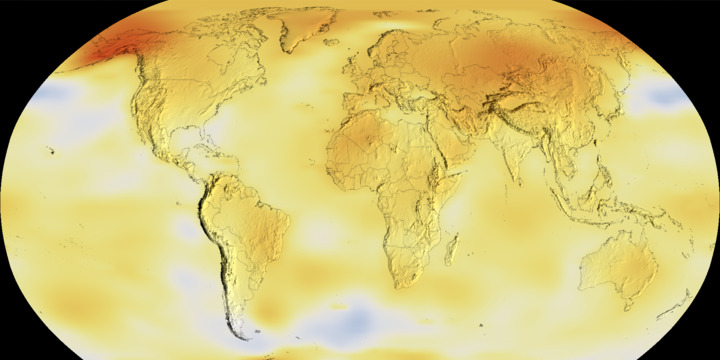
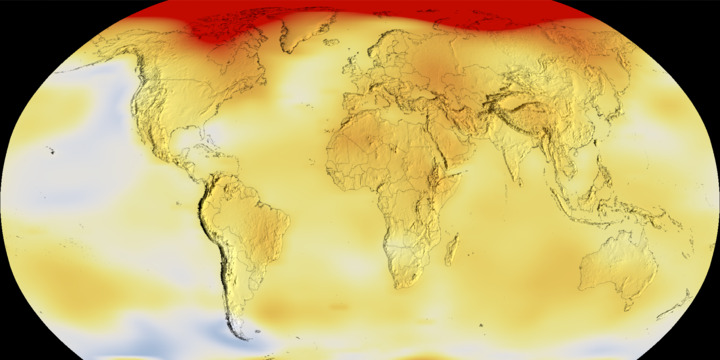
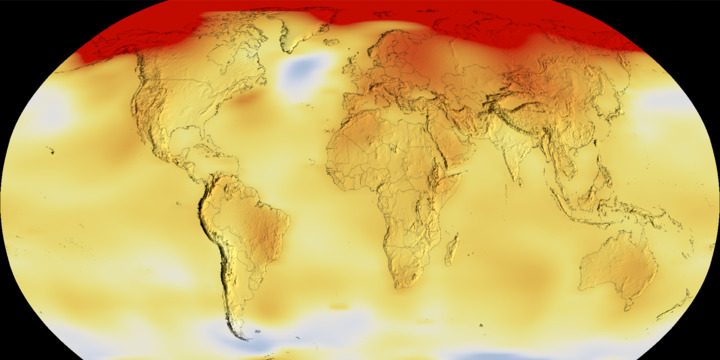
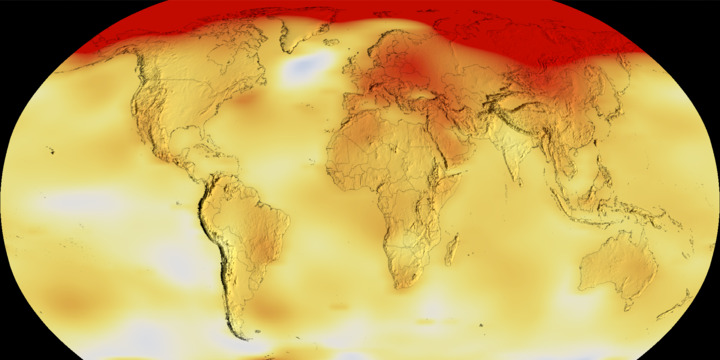
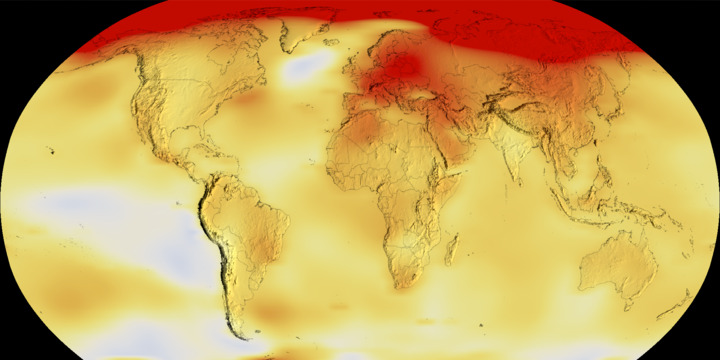

1953
2022
The animation on the right shows the change in global surface temperatures. Dark blue shows areas cooler than average. Dark red shows areas warmer than average. Short-term variations are smoothed out using a 5-year running average to make trends more visible in this map.
Sea Level
Sea level refers to the average height of the ocean’s surface.

The Earth’s seas are rising at a higher rate than they have in the past. This change is a direct result of a changing climate.
Increased Greenhouse Gases Lead to Global Sea Level Rise
This animation shows the rise in global mean sea level from 1993 to 2023 based on data from a series of five international satellites. The spike in sea level from 2022 to 2023 is mostly a consequence of climate change and the development of El Niño conditions in the Pacific Ocean.Credit: NASA's Scientific Visualization Studio.
What Couses Global Sea Level Rise?
- Greenhouse gases added to the atmosphere by human activities are warming the planet.
- Global sea level is rising mainly from ocean warming and melting land ice due to climate change.
- Global sea level is rising faster today than it was 100 years ago.

- For over 100 years, humans have burned coal, gas, and oil to produce energy. Burning these fossil fuels releases greenhouse gases into the air.
- Around 90% of the added heat from greenhouse gases is being absorbed by the ocean, warming it up.Currently, about one third (around 33%) of global sea level rise is because of ocean warming.
- As Earth heats up, it melts the land ice, including the Greenland and Antarctic Ice Sheets and other mountain glaciers. The water then flows into the ocean which raises sea levels. Around 66% of global sea level rise is because of melting land ice.
COMING SOON...
COMING SOON...
COMING SOON...
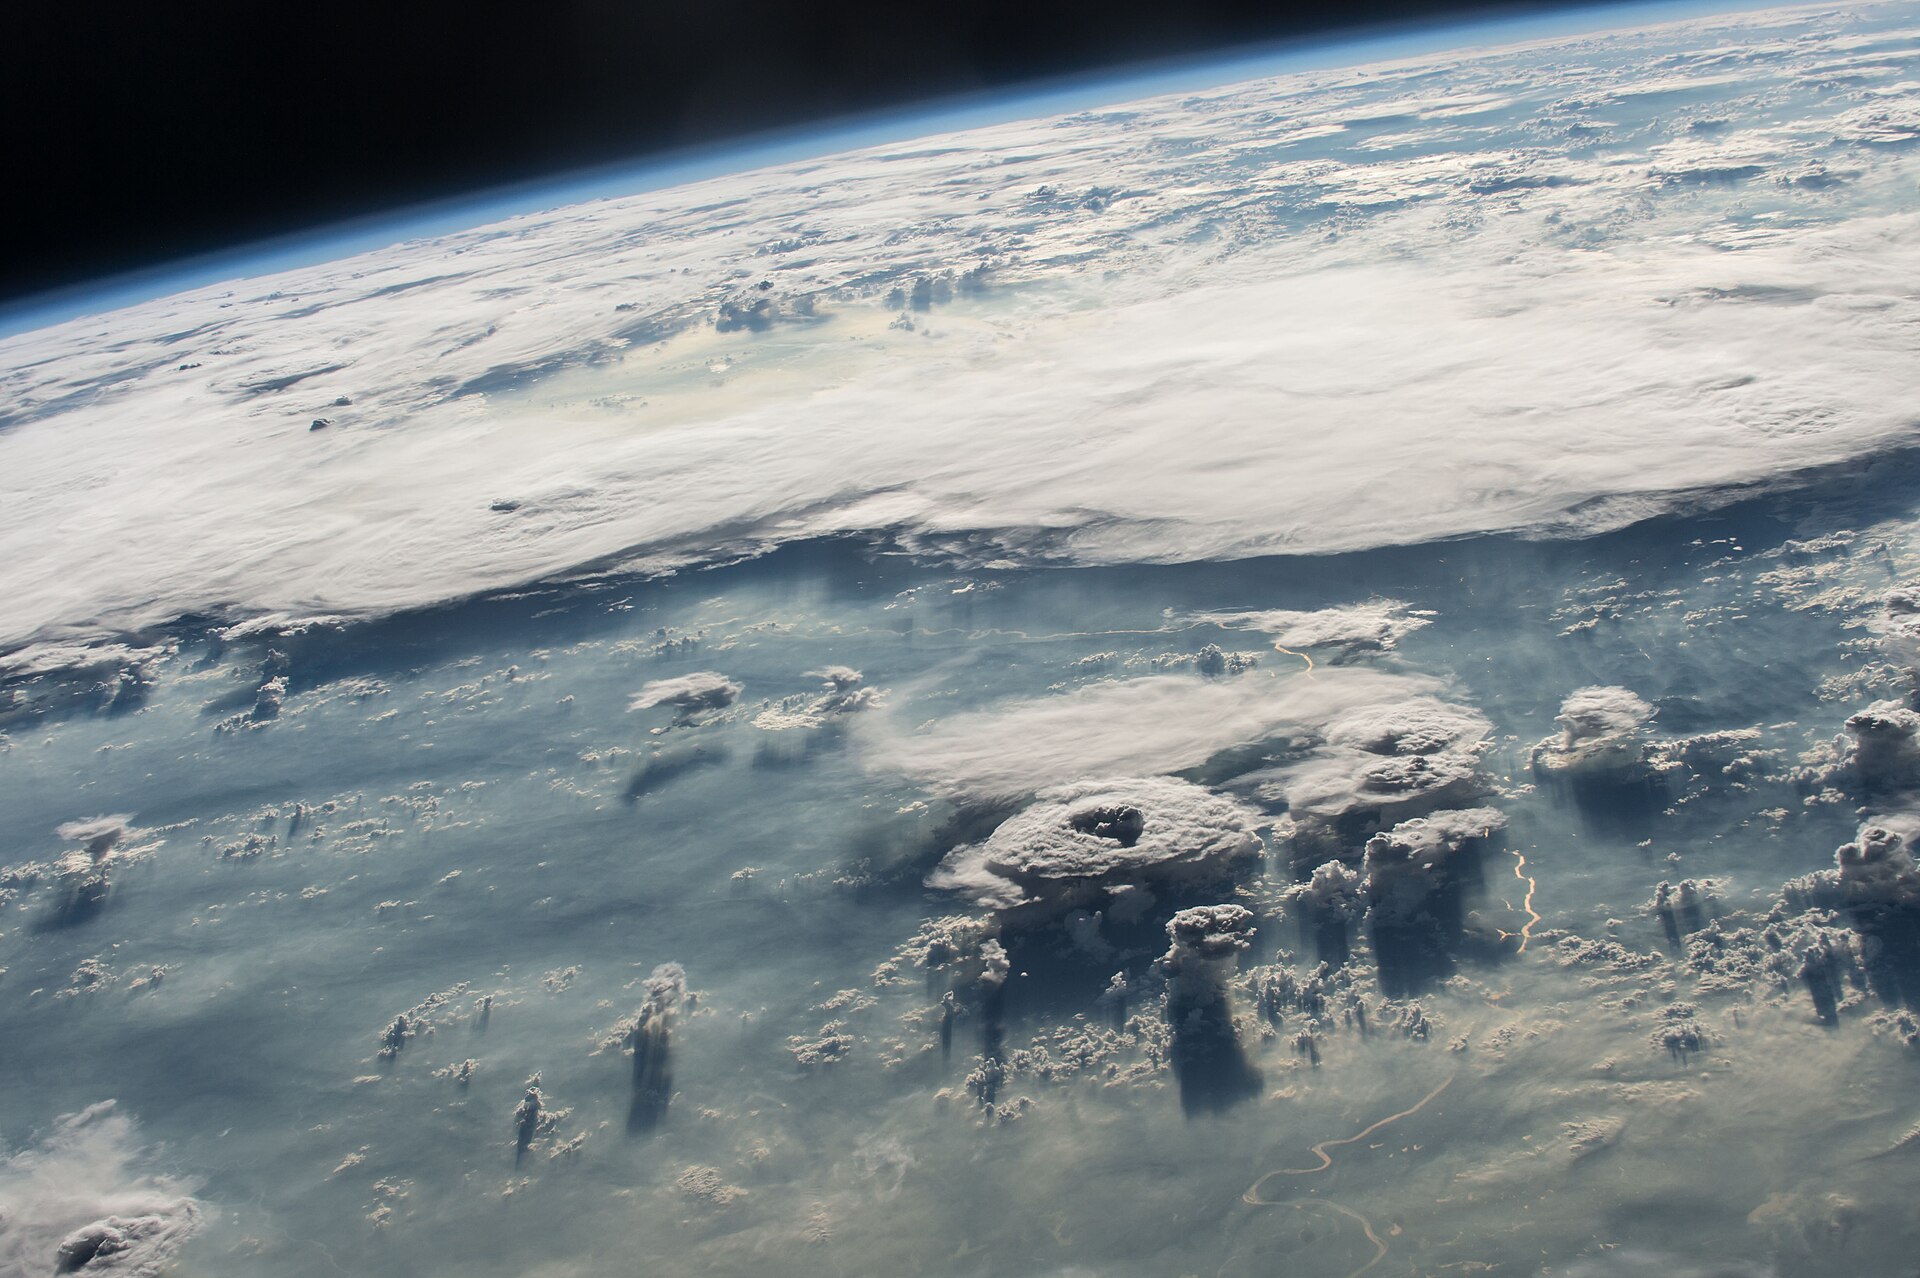
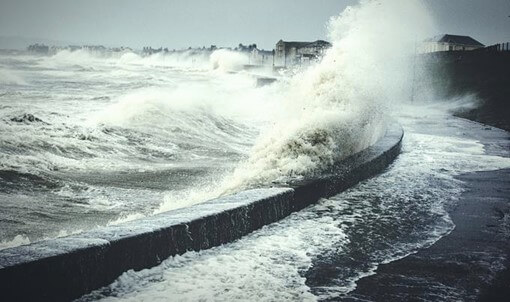
Natural Hazards
What Natural Hazard Means?
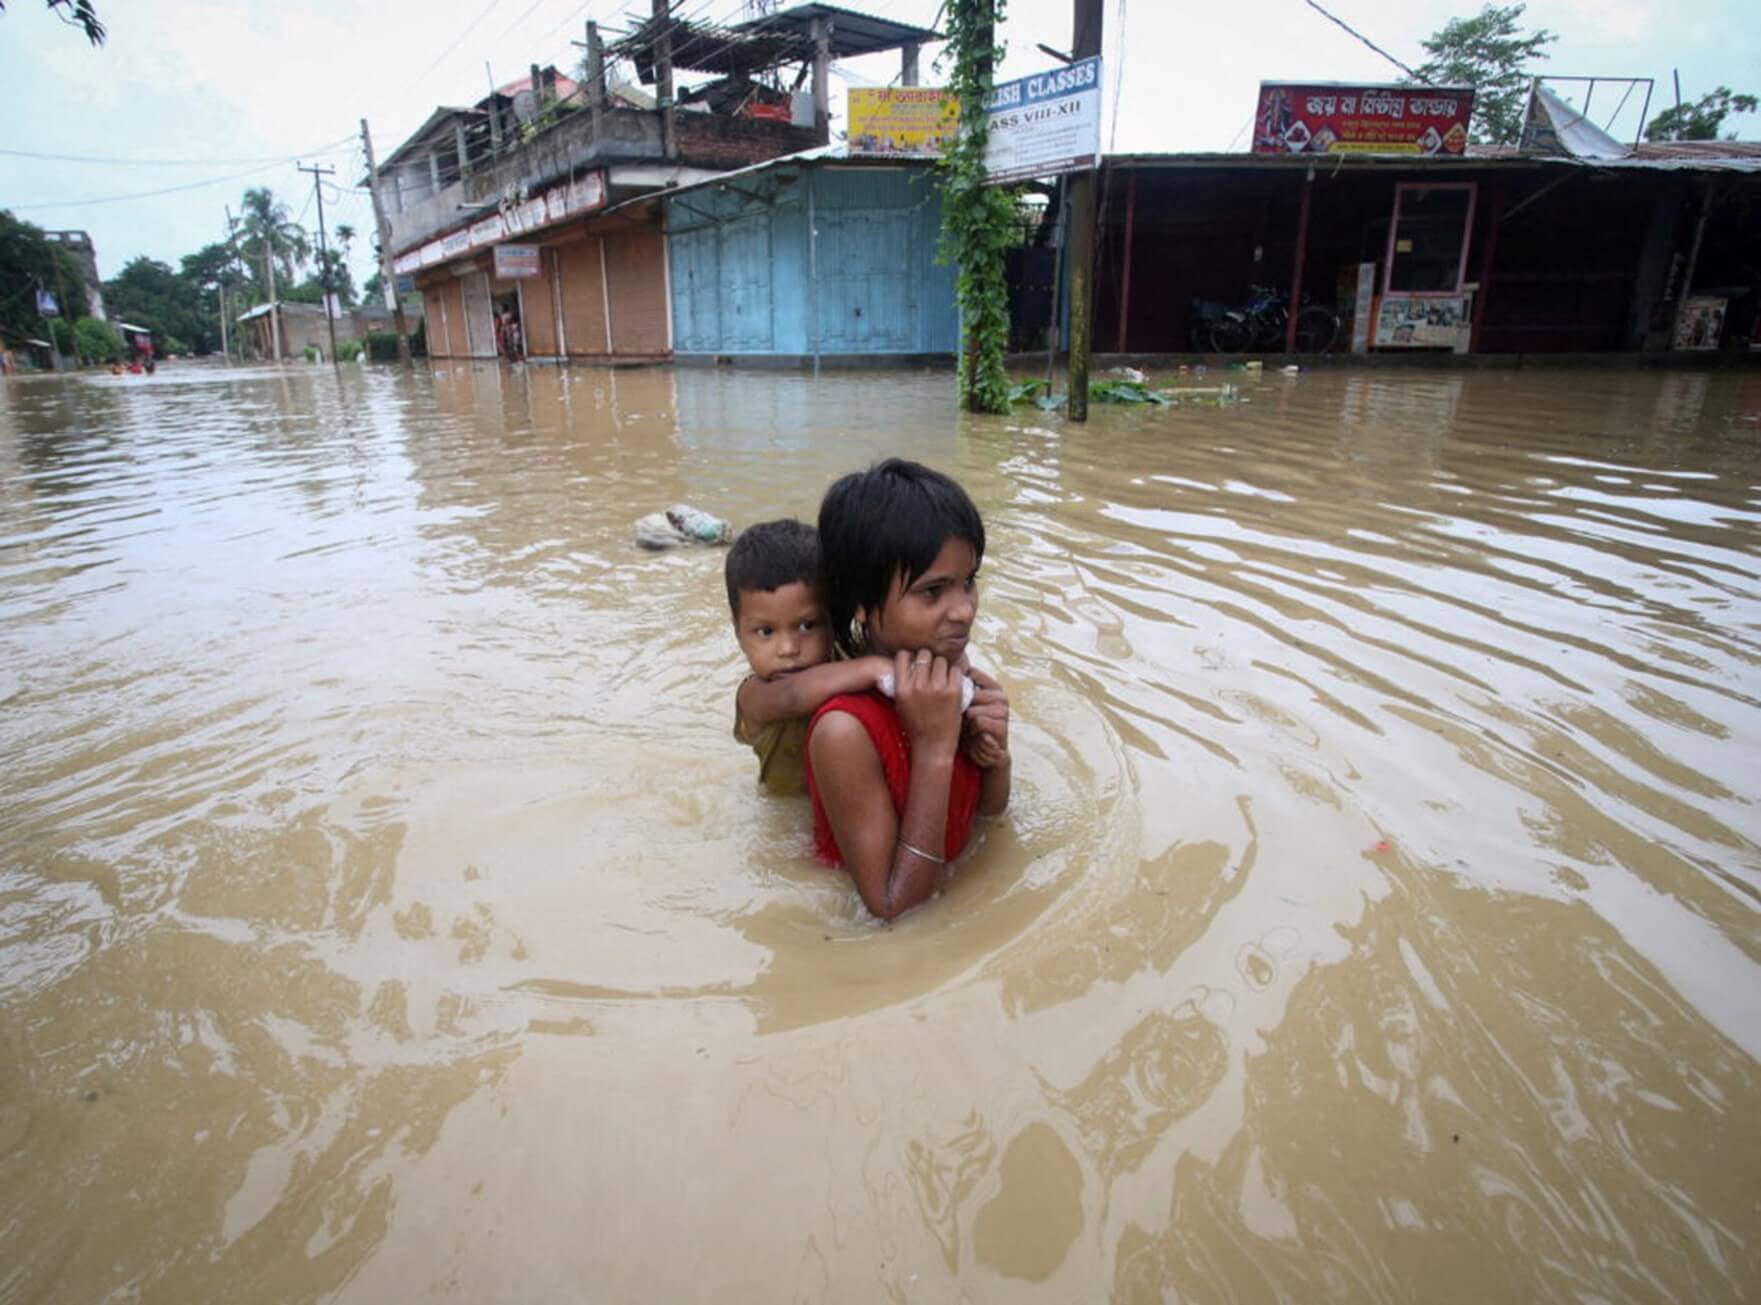
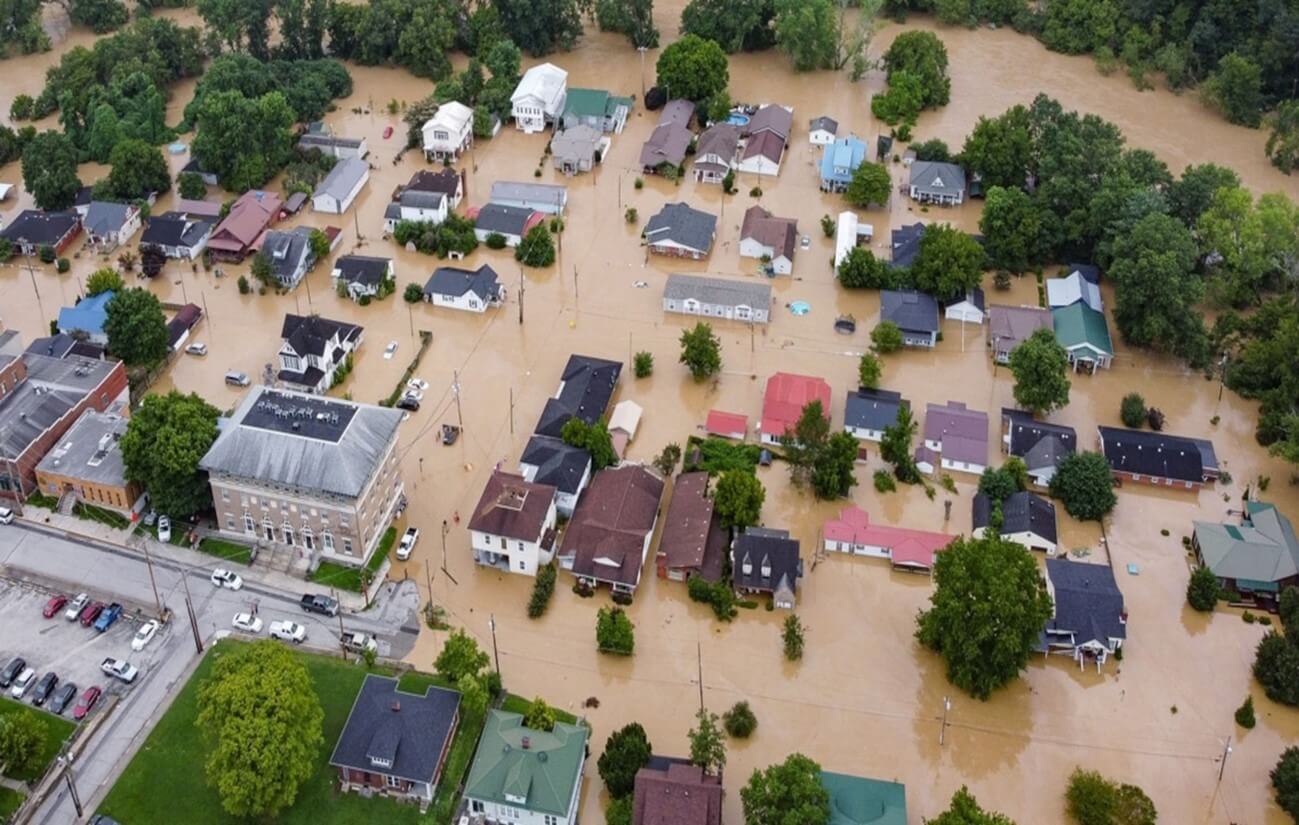
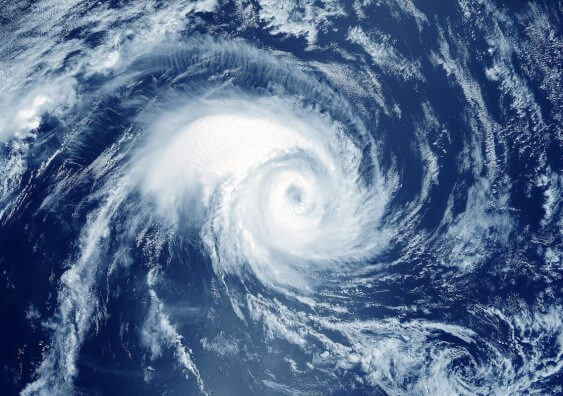
Natural hazards are extreme environmental events that have the potential to cause significant harm to human societies and the environment. These events can lead to loss of life, injury, property damage, and disruption of human activities
Climate change increases the frequency and severity of natural hazards like heatwaves, floods, droughts, and storms by altering temperatures, precipitation patterns, and sea levels.
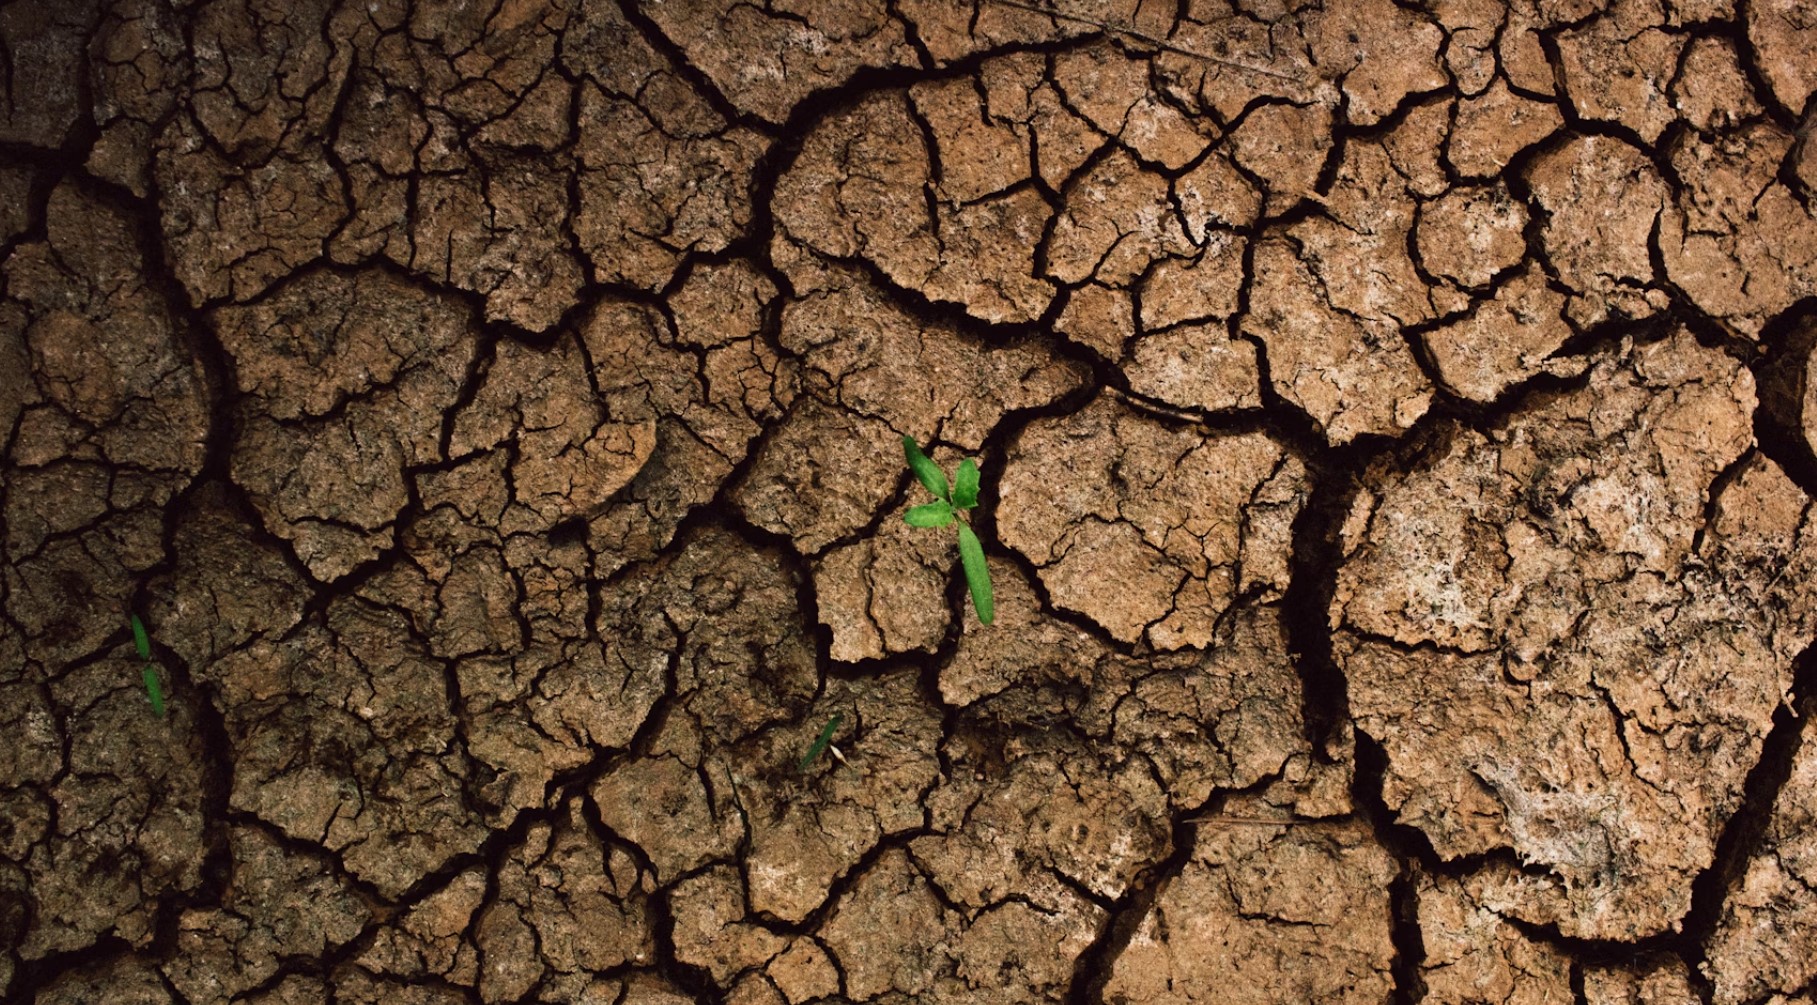
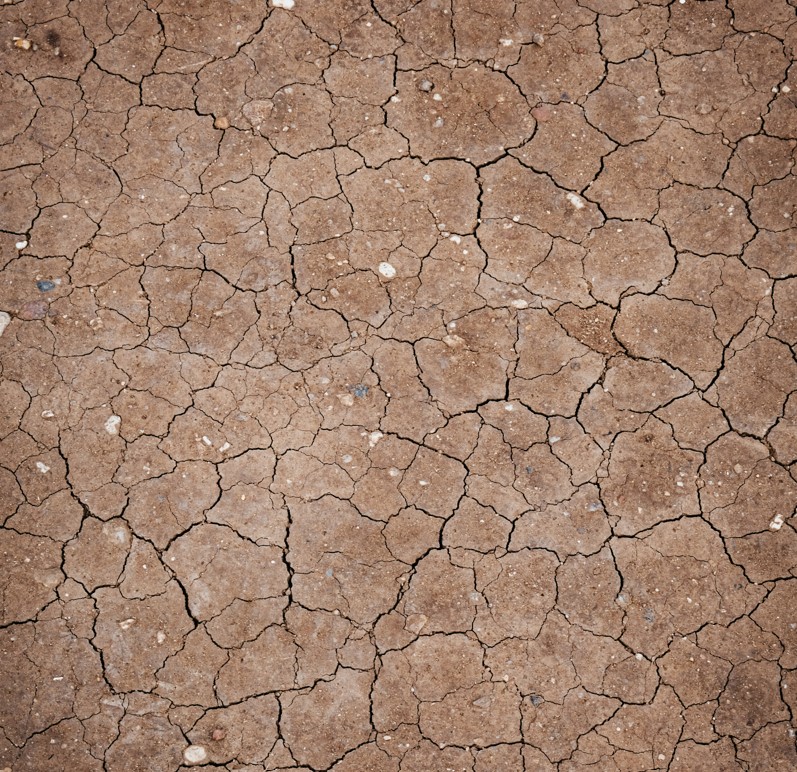
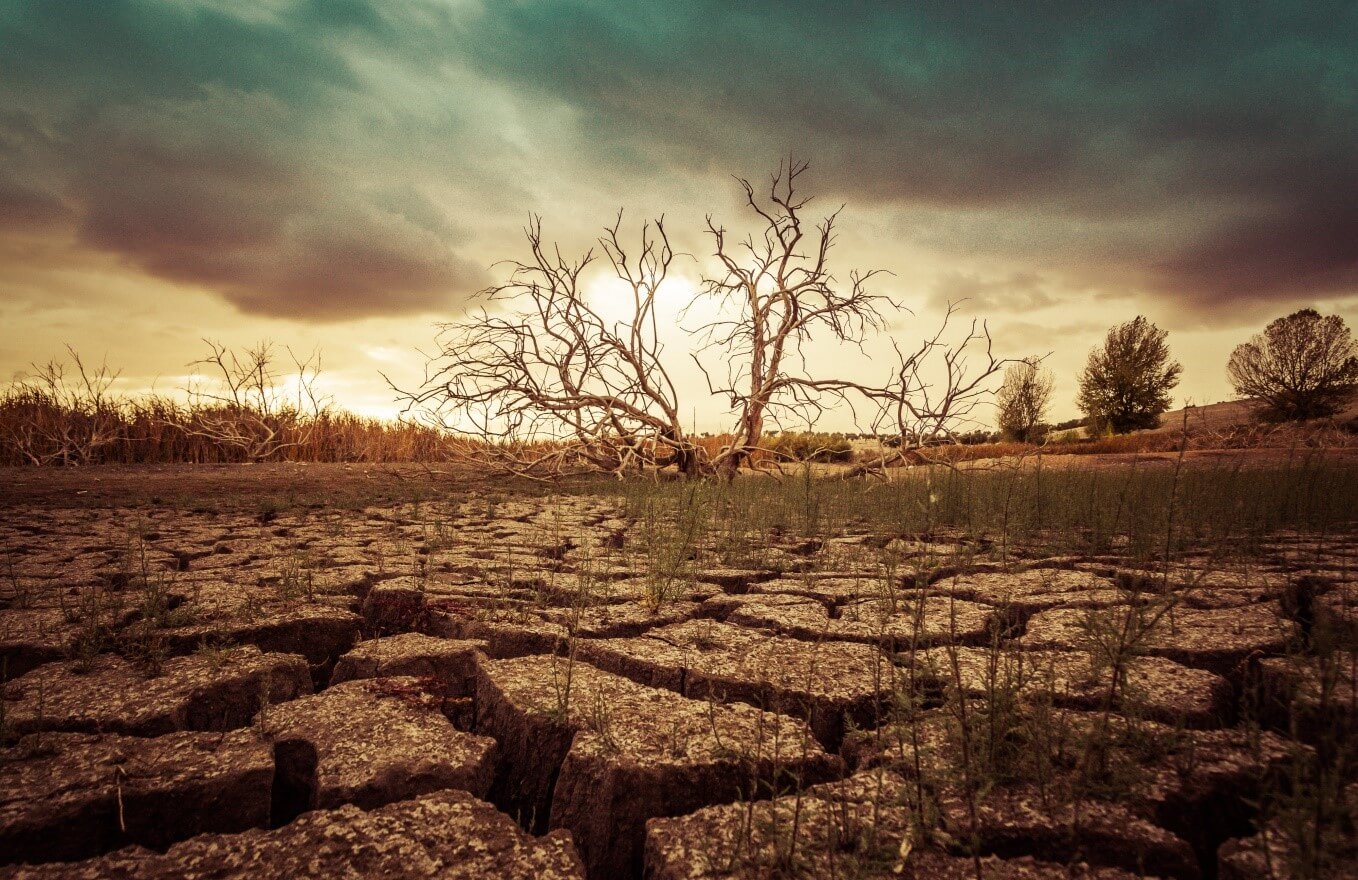
What is Drought?
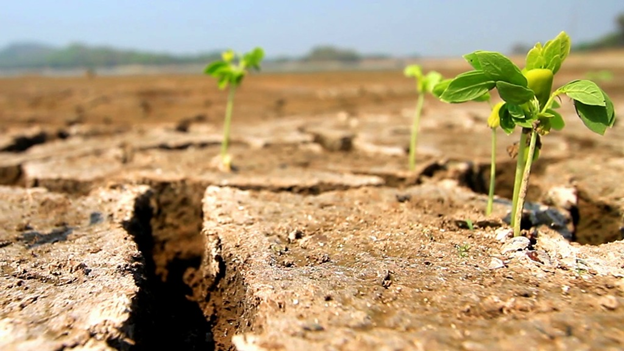
Drought is a prolonged period of abnormally low rainfall, leading to water shortages, low soil moisture, and stressed vegetation. It affects agriculture, ecosystems, and water supplies.
The National Weather Service office of the NOAA defines drought as "a deficiency of moisture that results in adverse impacts on people, animals, or vegetation over a sizeable area".
Categories
There are three major categories of drought based on where in the water cycle the moisture deficit occurs:
Meteorological
- Meteorological Drought occurs when there is a prolonged time with less than average precipitation.
- Usually precedes the other kinds of drought.
- As the drought persists, the conditions surrounding it gradually worsen and its impact on the local population gradually increases.
Hydrological
- Hydrological drought is brought about when the water reserves available in sources fall below a locally significant threshold.
- Tends to show up more slowly because it involves stored water that is used but not replenished.
Agricultural
- Agricultural or ecological droughts affect crop production or ecosystems in general
- Also arise independently from any change in precipitation levels when either increased irrigation or soil conditions and erosion triggered by poorly planned agricultural endeavors cause a shortfall in water available to the crops.
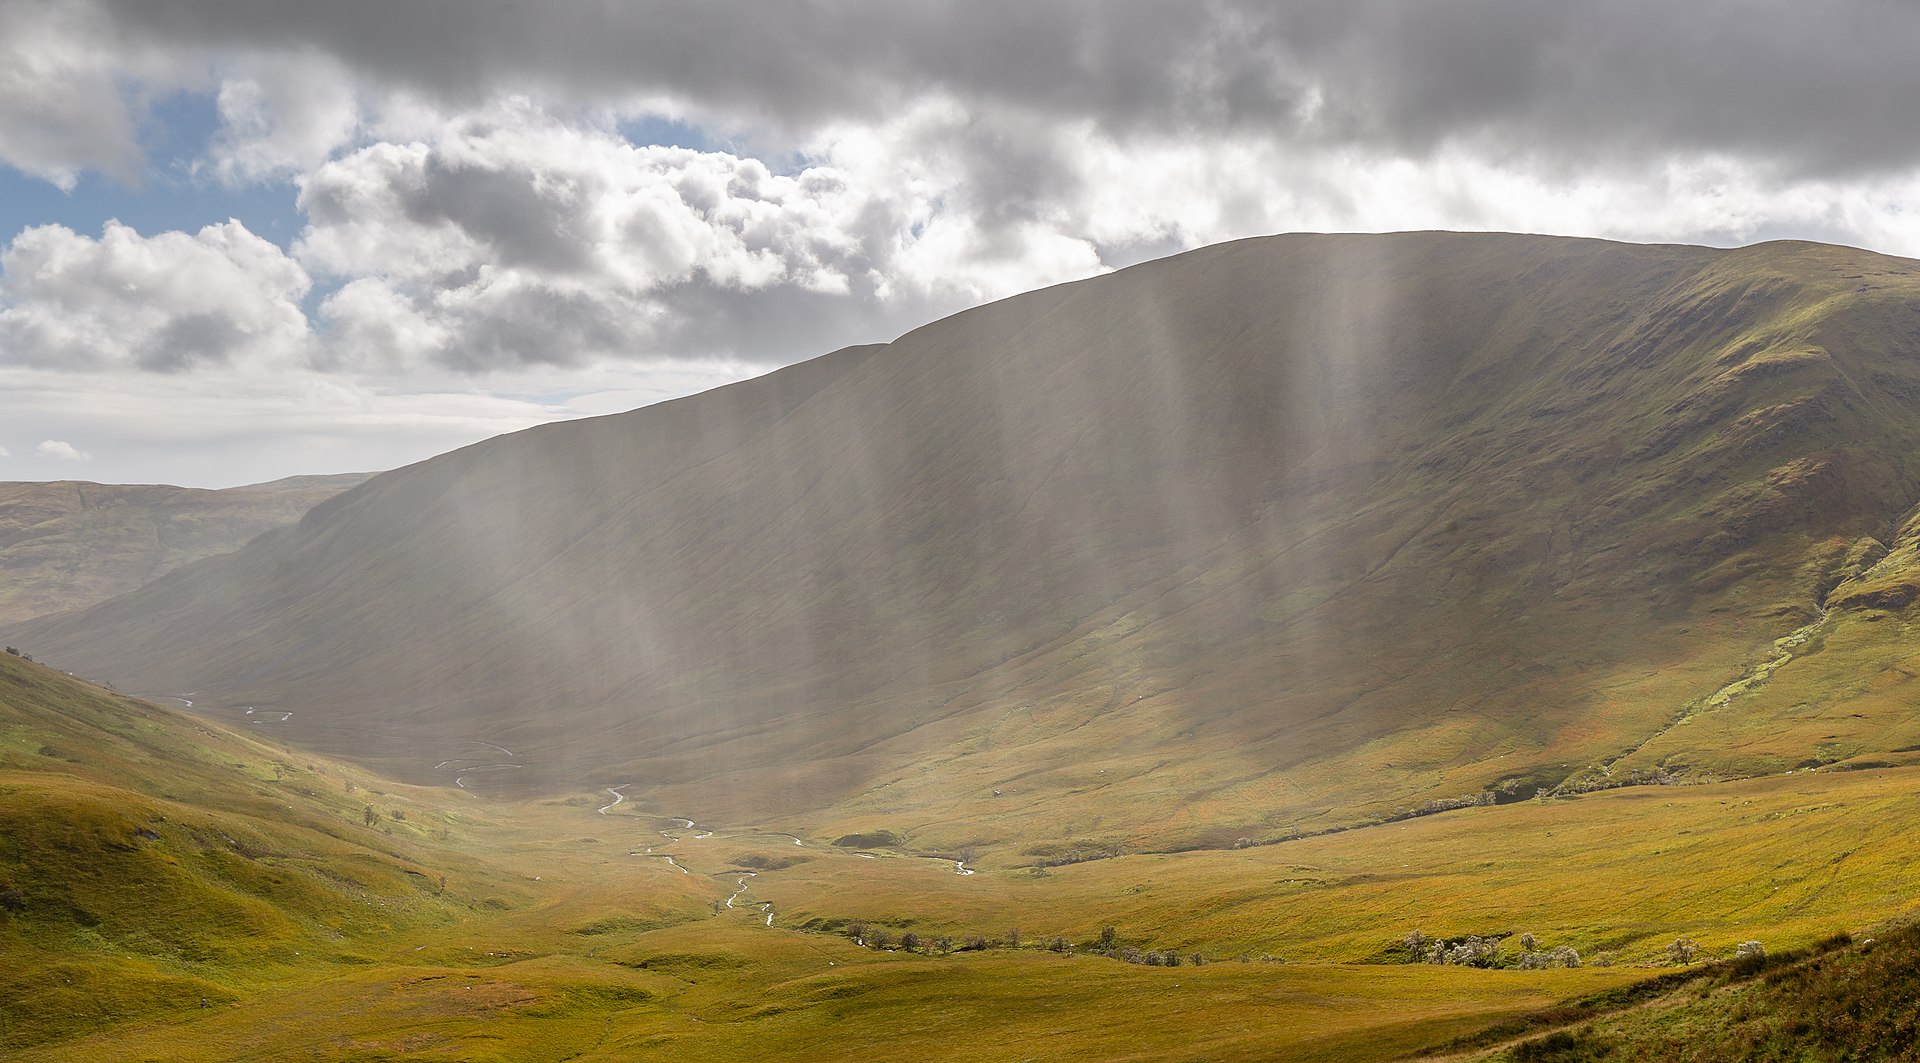
What Causes Drought?
Drought is a recurring feature of the climate in most parts of the world, becoming more extreme and less predictable due to climate change.
General Precipitation Deficiency
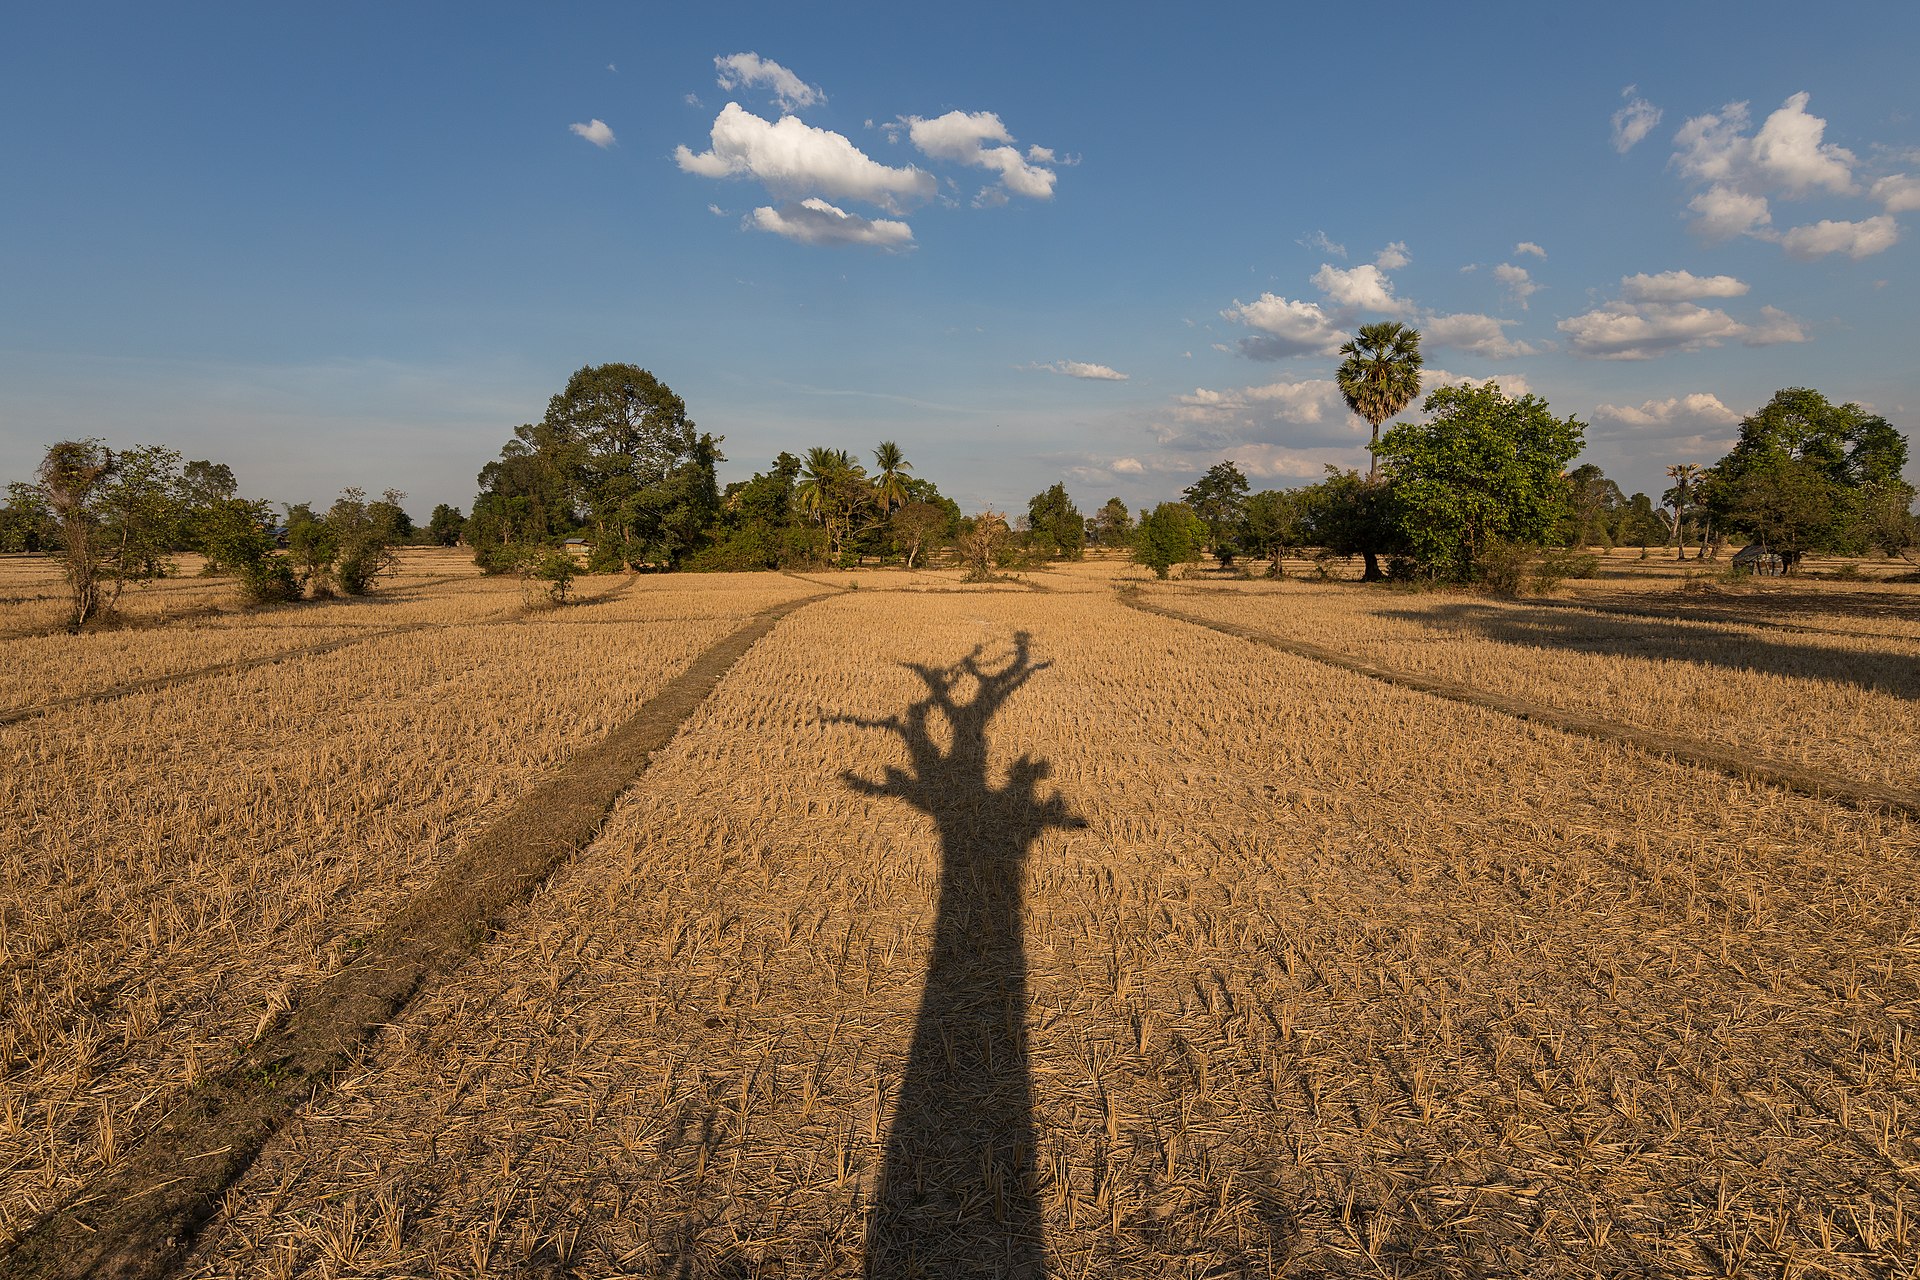
Dry season
Climate change
El Niño–Southern Oscillation (ENSO)
Erosion and human activities
Impacts
Droughts are the second-most costly weather events after hurricanes. Unlike with sudden weather events such as hurricanes, tornadoes, and thunderstorms, it is often difficult to pinpoint when a drought has started or when it has ended. The longer a drought lasts, the greater the harmful effects it has on people.
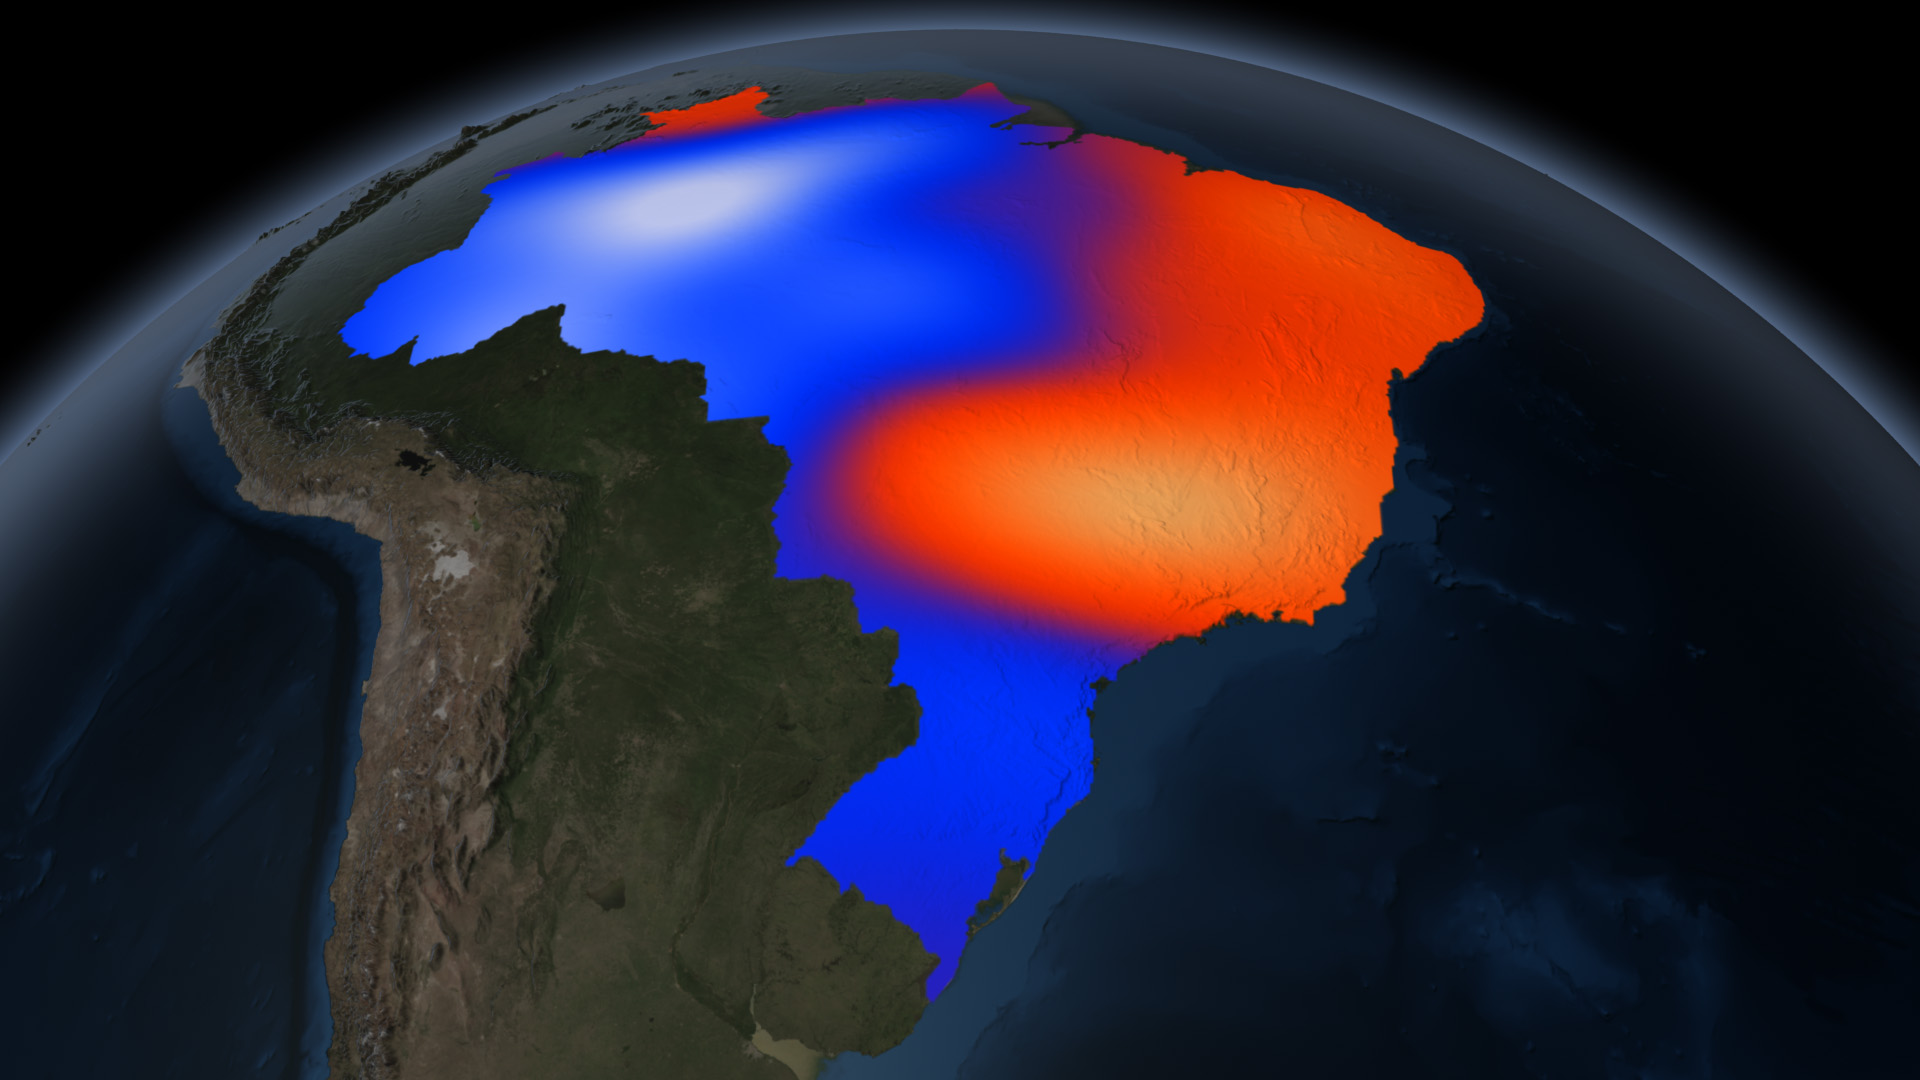
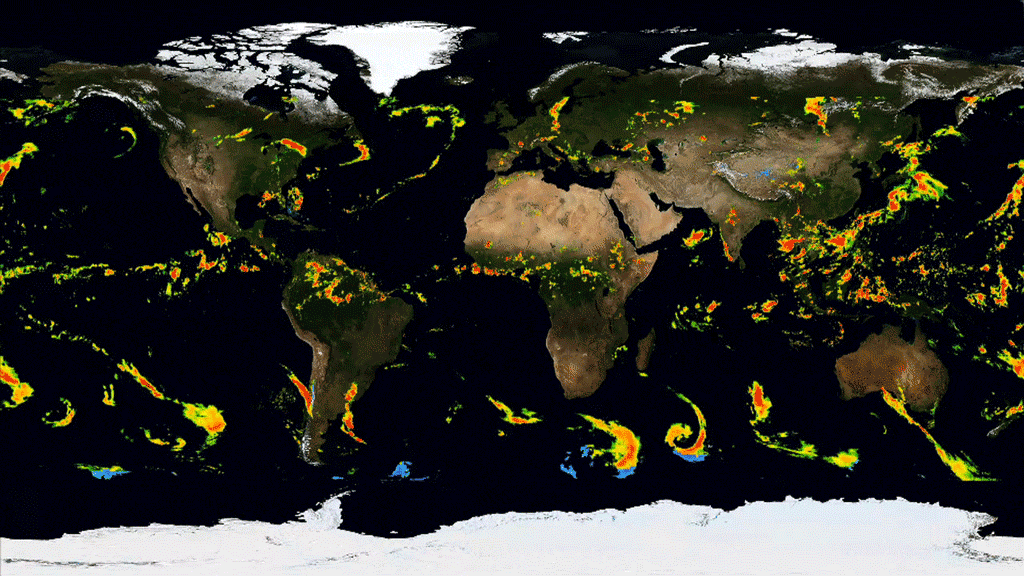
NASA | Brazil’s Extreme Drought Seen From Space
NASA | Brazil’s Extreme Drought Seen From Space
Environmental Impacts
- Lower surface and subterranean water-levels
- Lower flow-levels (with a decrease below the minimum leading to direct danger for amphibian life)
- Increased pollution of surface water
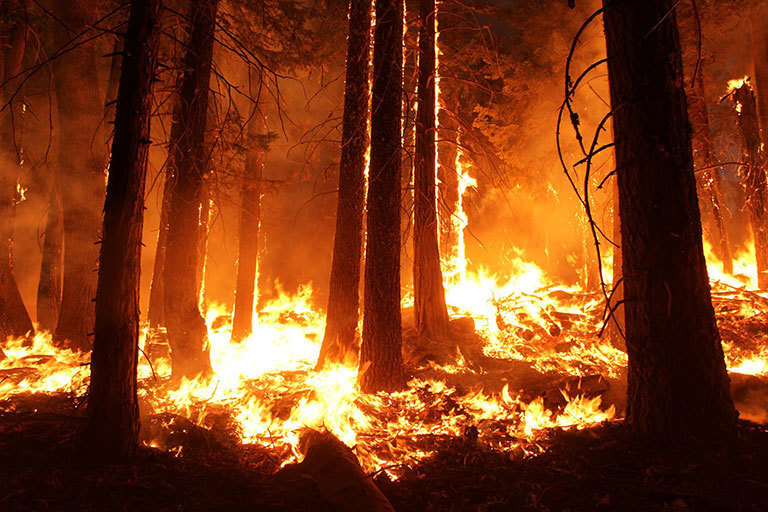
- The drying out of wetlands, more and larger wildfires, higher deflation intensity
- Loss of biodiversity, worse health of trees and the appearance of pests and dendroid diseases
Economic Impacts
- Lower agricultural, forests, game and fishing output
- Higher food-production costs, lower energy-production levels in hydro plants
- Losses caused by depleted water tourism and transport revenue
- Disruption of water supplies for municipal economies.
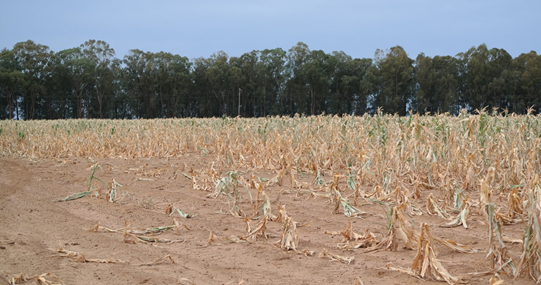
Agricultural Impacts
- Land degradation and loss of soil moisture, resulting in the destruction of cropland productivity
- Poor germination and impaired seedling development for plants.
- The reduction in crop yield results from a decrease in photosynthetic rate
Social and health impacts
- Crop failure, food crisis, famine, malnutrition, and poverty, which lead to loss of life and mass migration of people.
- Limitations of water supplies, increased water pollution levels, high food-costs, stress caused by failed harvests.
- Social unrest
- War over natural resources, including water and food can be a devastating consequence.
Loss of Fertile Soils
- Wind erosion is much more severe in arid areas and during times of drought.
- Soil erosion
- Desertification
- Loss of Vegetation
- Reduces soil moisture
Regions Particularly Affected
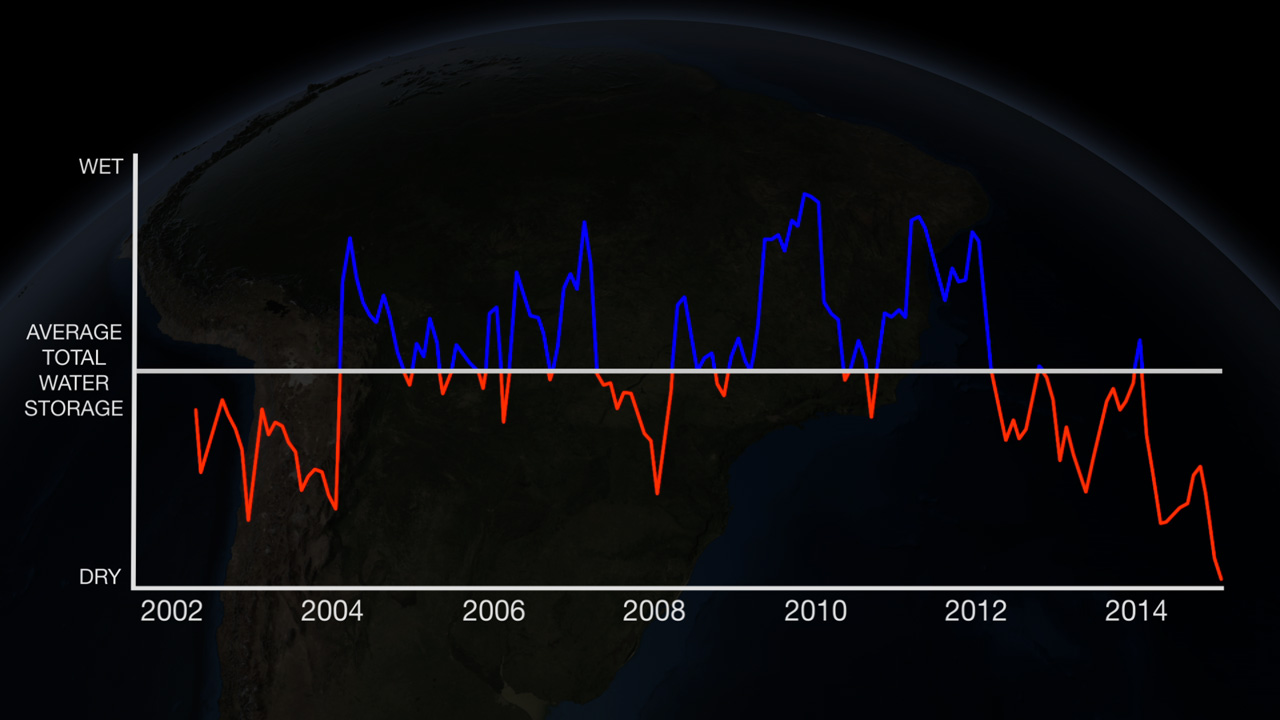
- Amazon Basin: In 2005, parts of the Amazon basin experienced the worst drought in 100 years.
- Australia: The 1997–2009 Millennium Drought in Australia led to a water supply crisis across much of the country.
- Himalayan River Basins: Approximately 2.4 billion people live in the drainage basin of the Himalayan rivers.[93] India, China, Pakistan, Bangladesh, Nepal and Myanmar could experience floods followed by droughts in coming decades.
Protection
Water Conservation: Implementing water-saving techniques in agriculture, industry, and households to reduce water usage.
Sustainable Agriculture: Using drought-resistant crops and efficient irrigation systems to minimize water consumption.
Forest and Land Management: Protecting and restoring forests and wetlands to maintain natural water cycles and prevent soil erosion.
Mitigation
Drought Monitoring and Early Warning Systems: The GRACE-FO (Gravity Recovery and Climate Experiment Follow-On) mission provides data for assessing changes in groundwater levels, and NASA’s Drought Monitor helps track the intensity and duration of droughts.
Infrastructure Improvements: Building and maintaining reservoirs, dams, and water distribution systems to store and manage water more effectively.
Policy and Planning: Developing and enforcing policies that promote sustainable water use and land management practices.
Relief
Financial Assistance: Providing emergency funds and loans to farmers, businesses, and communities affected by drought.
Technical Support: Offering guidance and resources to implement drought-resistant practices and technologies.
Community Support Programs: Establishing programs to support affected communities, including food and water distribution, and mental health services.
COMING SOON...
COMING SOON...
COMING SOON...
COMING SOON...
Influences of Climate Change
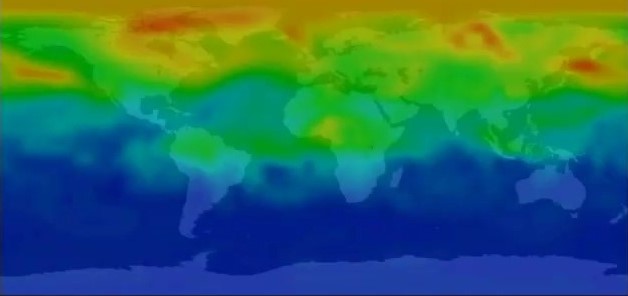
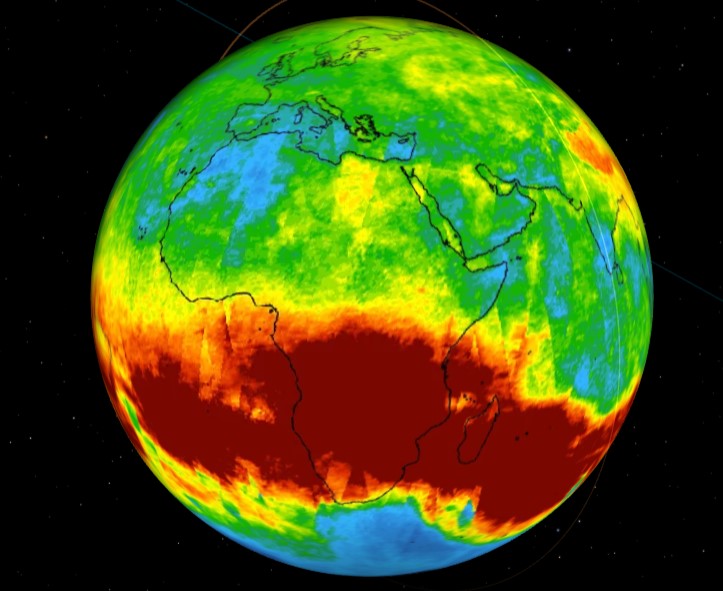
What is Air Quality?
Air quality is a measure of the pollution level in the air. Monitoring air quality is important because polluted air can be bad for human health and the environment.
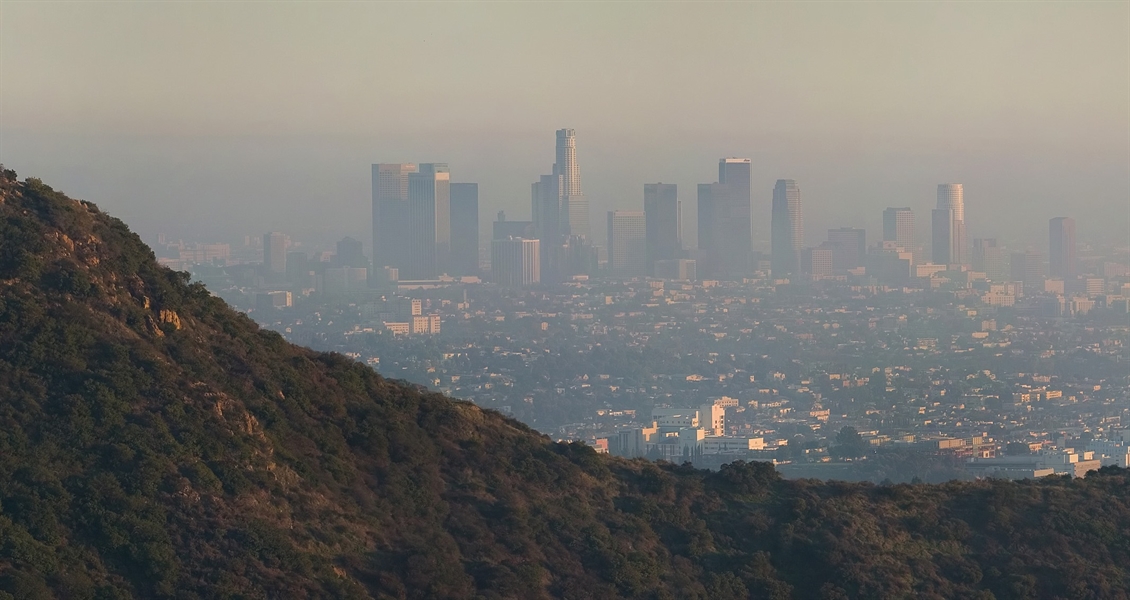
Image Credit: NOAA
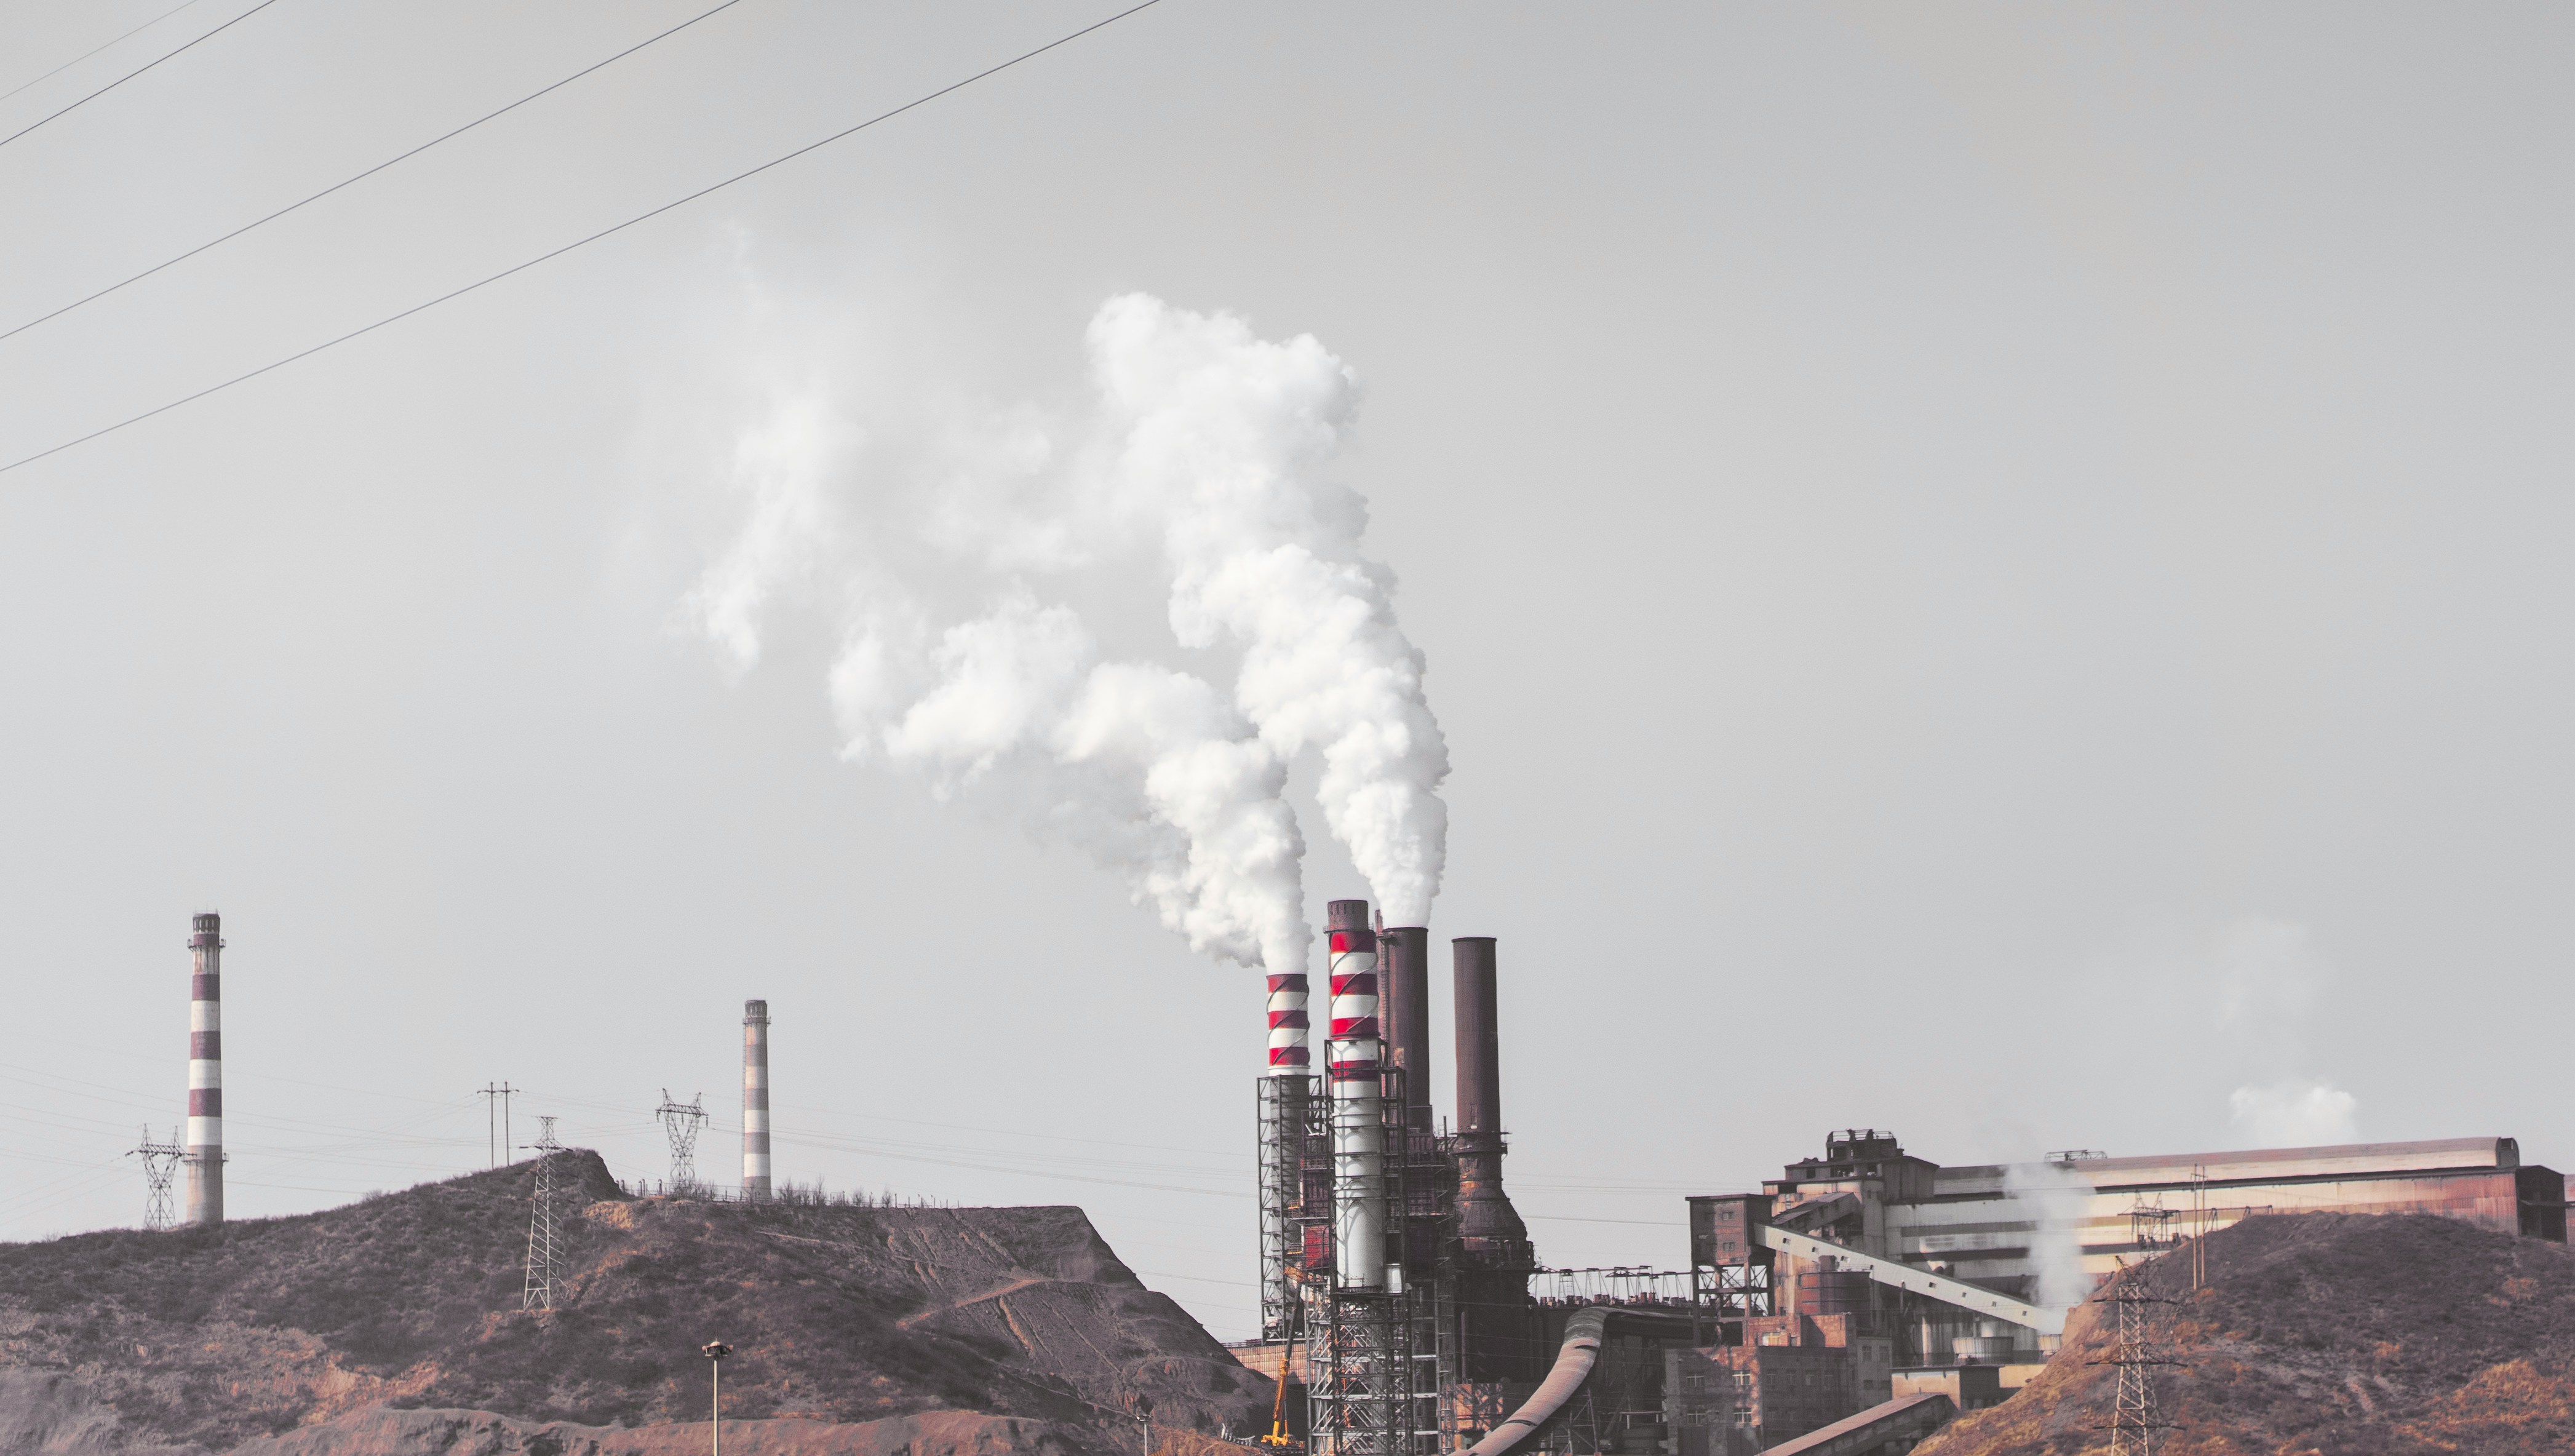
Sources of Air Pollution
Pollutants are formed from both natural and human sources.
Anthropogenic Sources
- Fuel combustion sources (such as electric utilities and boilers)
- Industrial processes (such as metal smelters, petroleum refineries, cement kilns and dry cleaners)
- Highway vehicles
- Other mobile sources (such as recreational and construction equipment, marine vessels, aircraft and locomotives)
Natural Sources
- Pollen
- Volcanoes (release of sulfates)
- Fires (release of organic/black carbon)
- Desert dust
- Sea salt
6 Criteria Pollutants
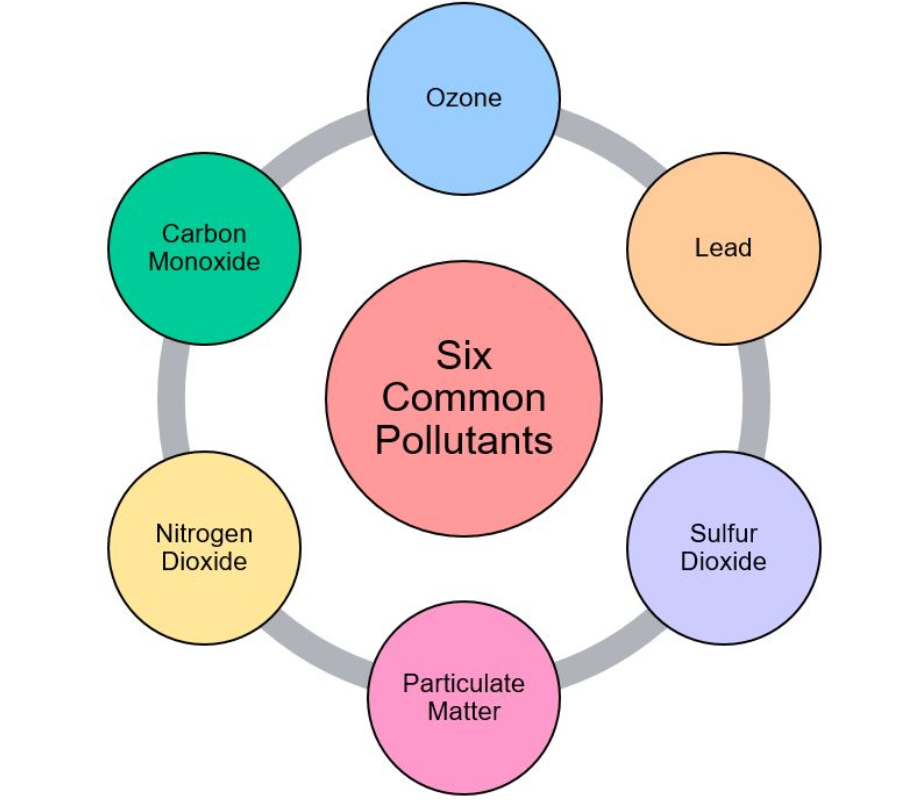
Carbon Monoxide
Lead
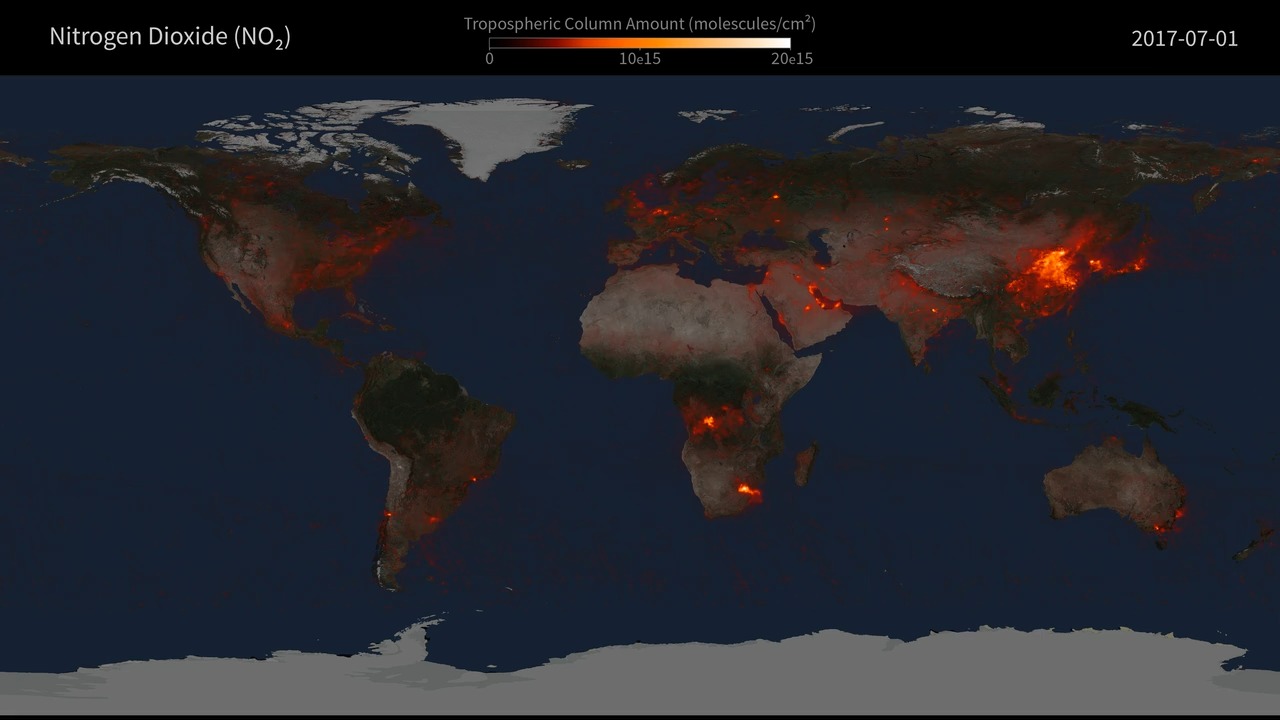
Nitrogen Dioxide
Ozone
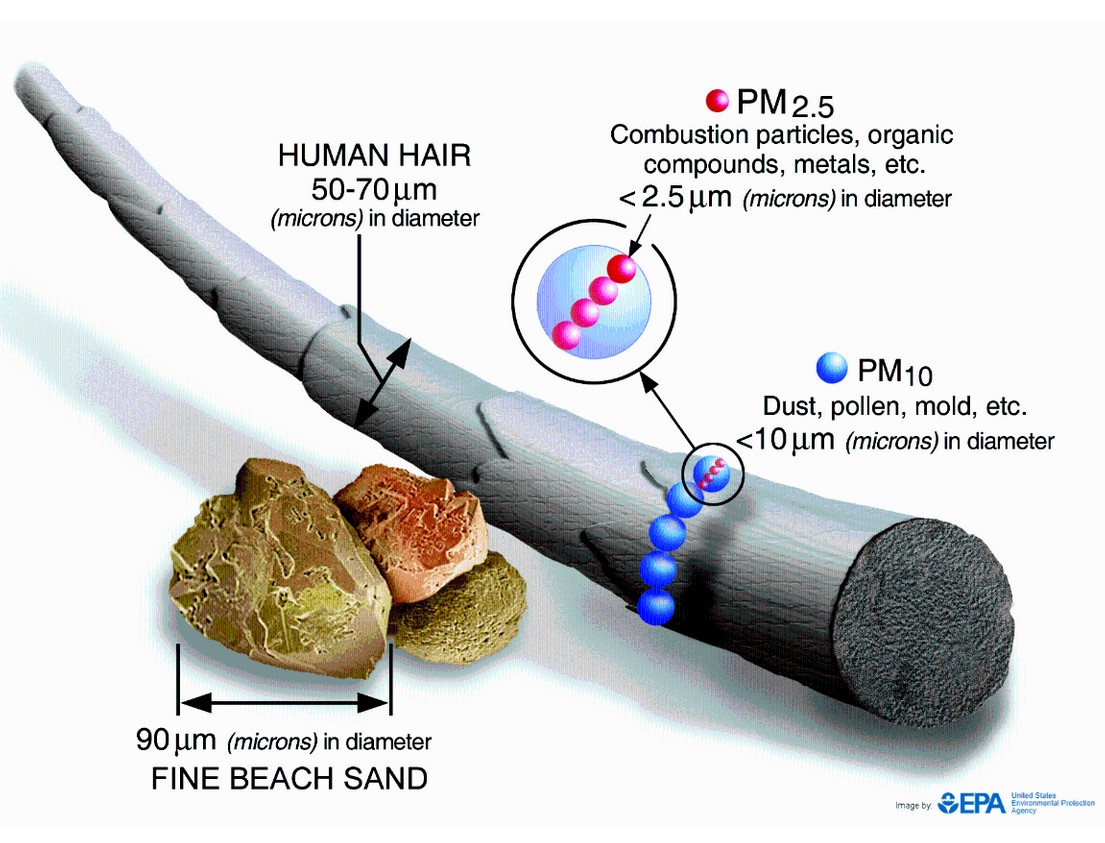
Particulate Matter
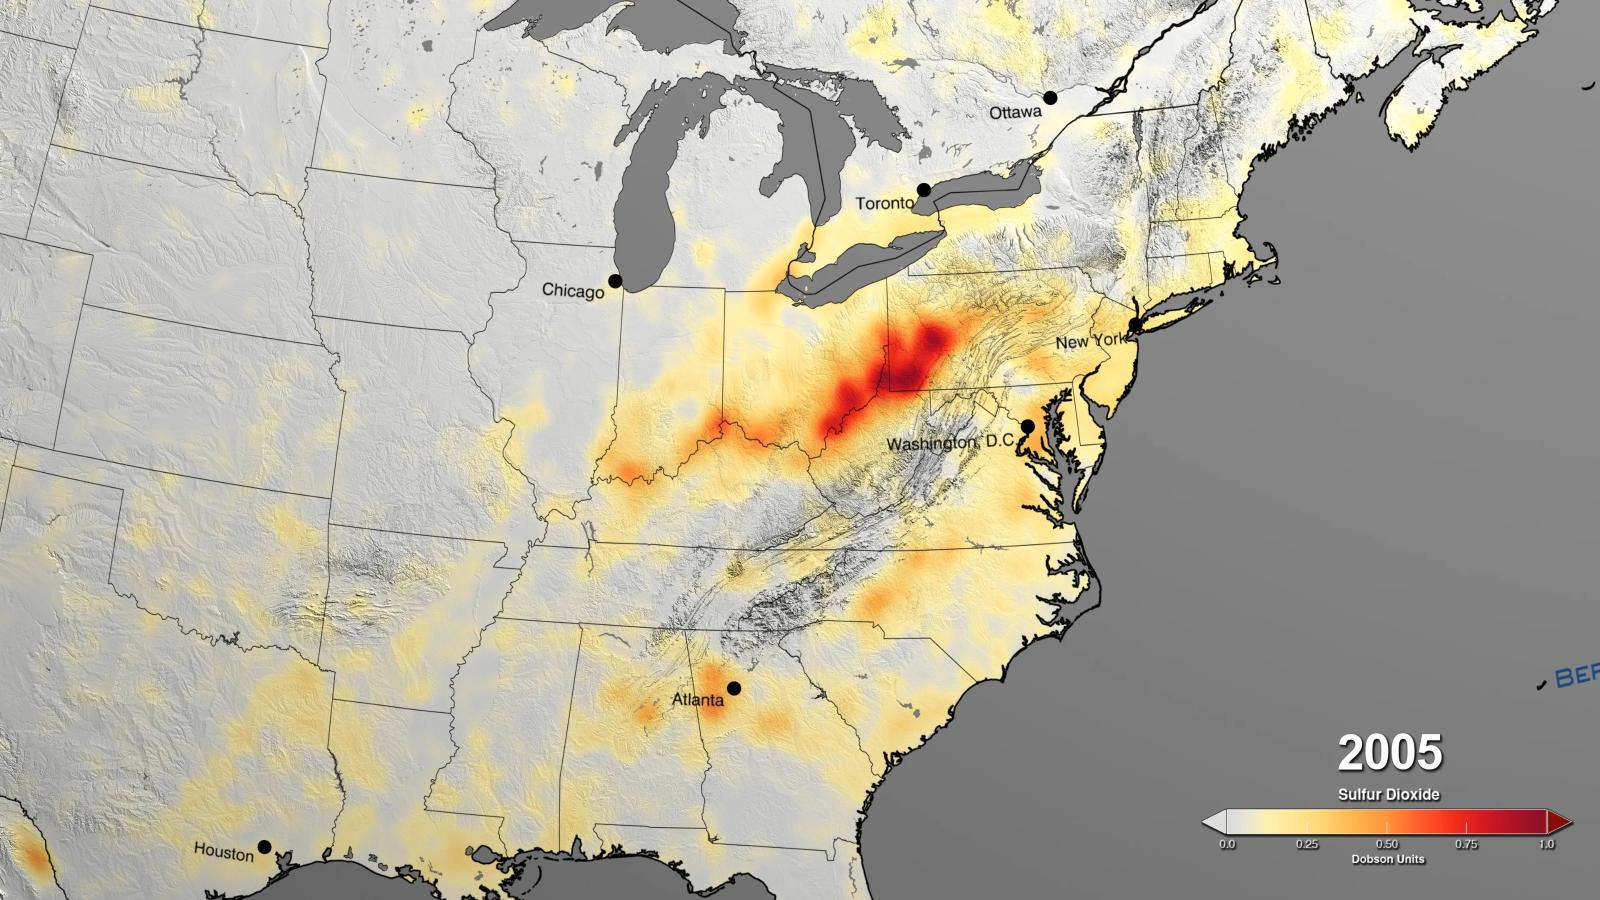
Sulfur Dioxide
Trends in Air Quality
While air quality can exceed standards in specific locations on specific days, the overall air quality in the U.S. has improved since 1990.
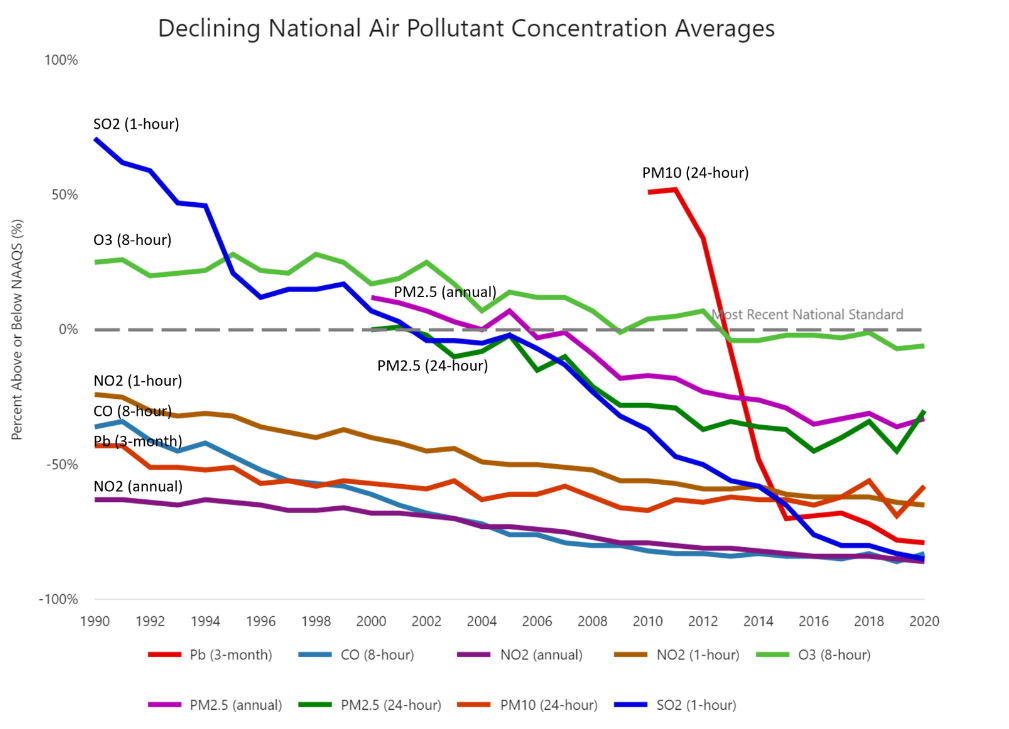
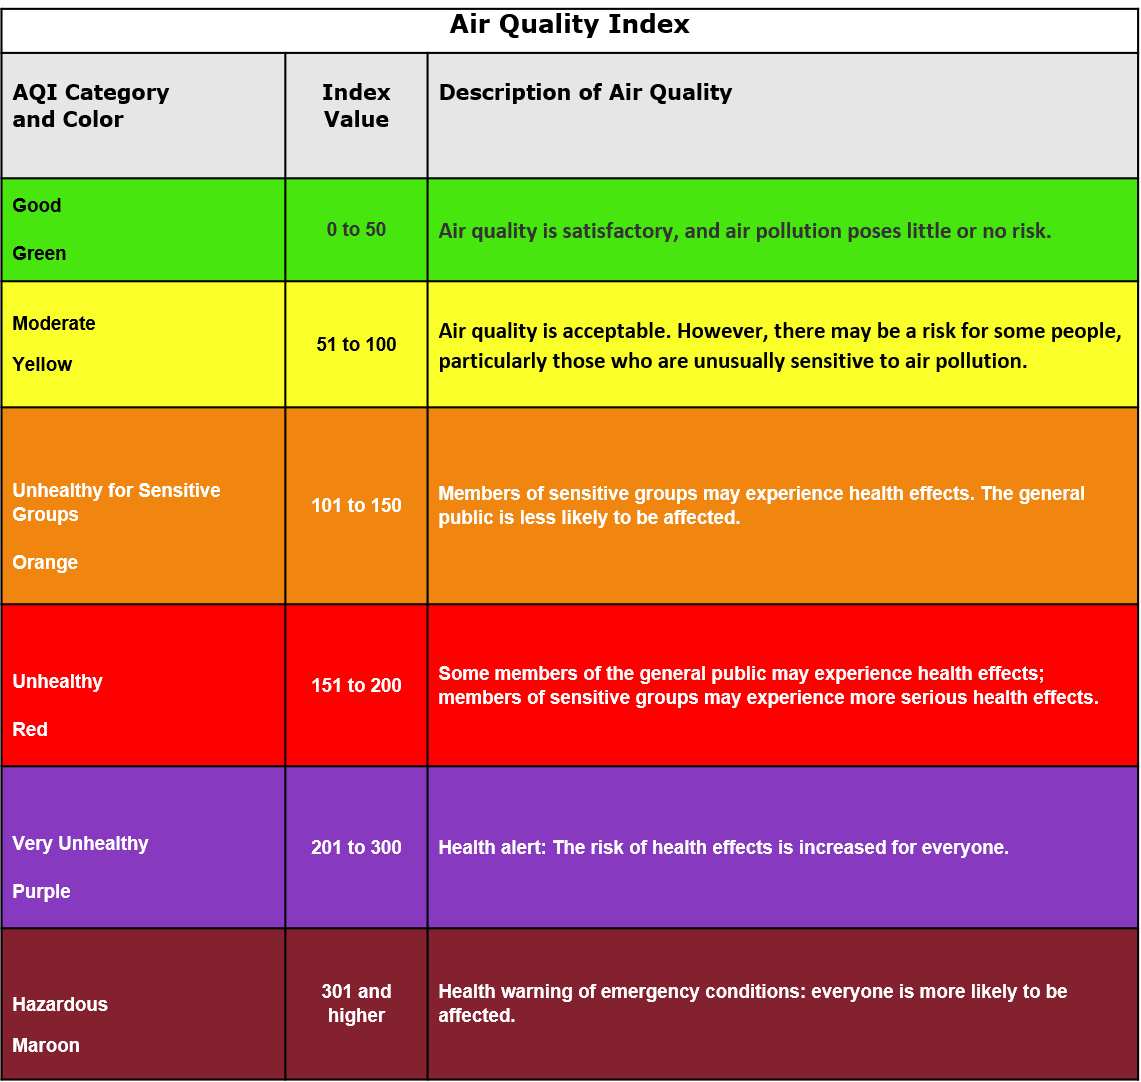
Air Quality index
The overall air quality in an area is measured using the U.S. Environmental Protection Agency's Air Quality Index, or AQI. AQI is a unitless number, from 0 to 500, that communicates the health risk caused by the amount of pollution in the air. Higher AQI values relate to increased health risk.
Air Sensors: Measurements and Your Health
Health Effects of Air Pollution
Short and long-term exposure to air pollution has been associated with a wide range of human health effects including increased respiratory symptoms, and heart or lung diseases. Hazardous (or toxic) air pollutants may cause cancer or other serious health effects.


Environmental Effects of Air Pollution
Harm to Animals and Plants
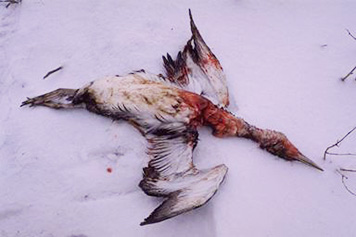
Air pollution can affect many parts of the environment. It can cause damage to plants and the respiratory systems of animals. It can also cause damage to entire habitats, water, or food sources that plants and animals need to survive.
Acid Rain
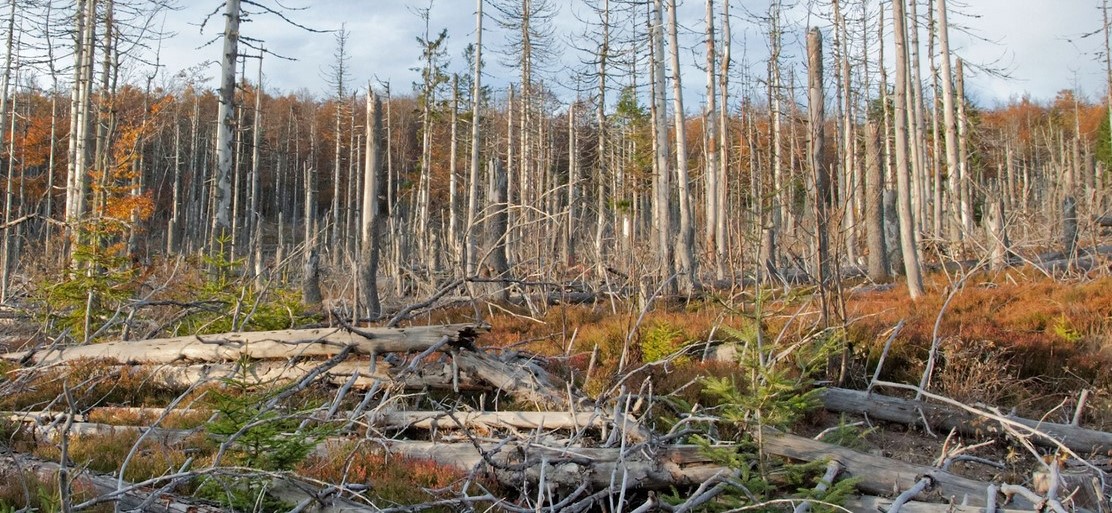
Acid rain forms when sulfur dioxide and nitrogen dioxide mix with water droplets in the atmosphere to make sulfuric acid and nitric acid. When the pollutants fall to the surface as acid rain, they can acidify the water and soil environments, damage vegetation, and even damage buildings and outdoor structures.
Haze
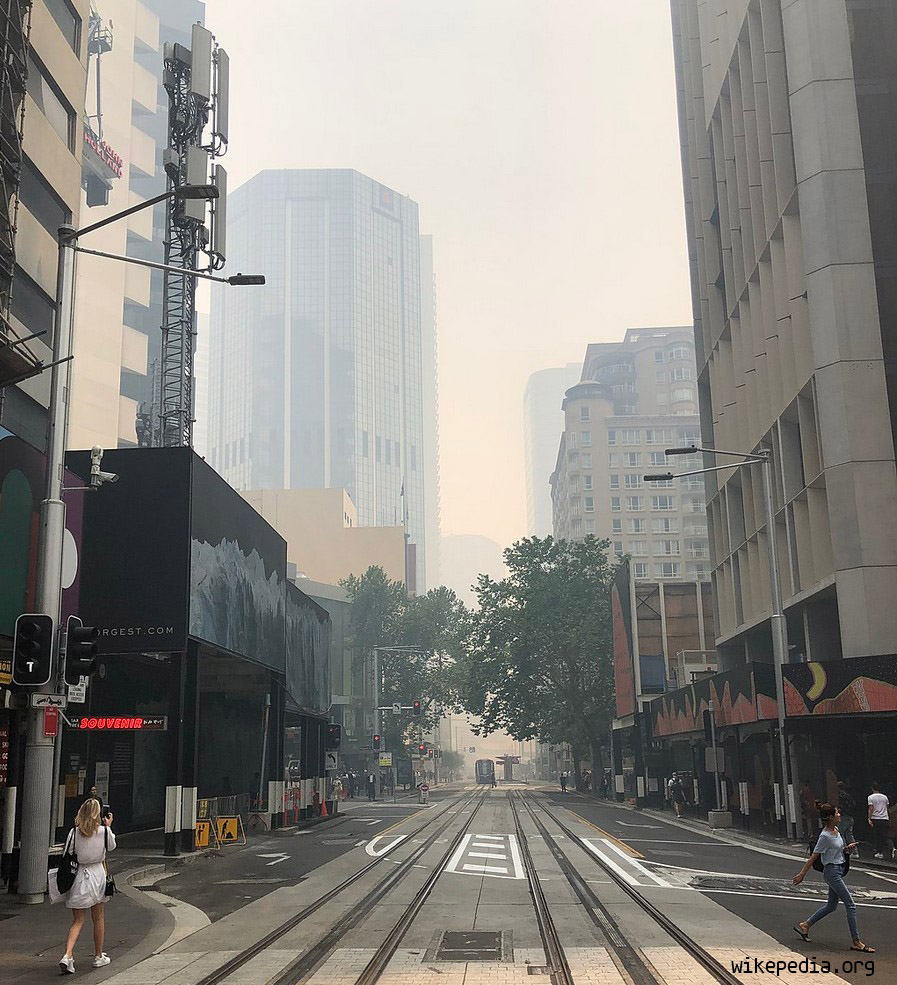
Haze is caused when sunlight encounters tiny pollution particles in the air. Haze obscures the clarity, color, texture, and form of what we see.
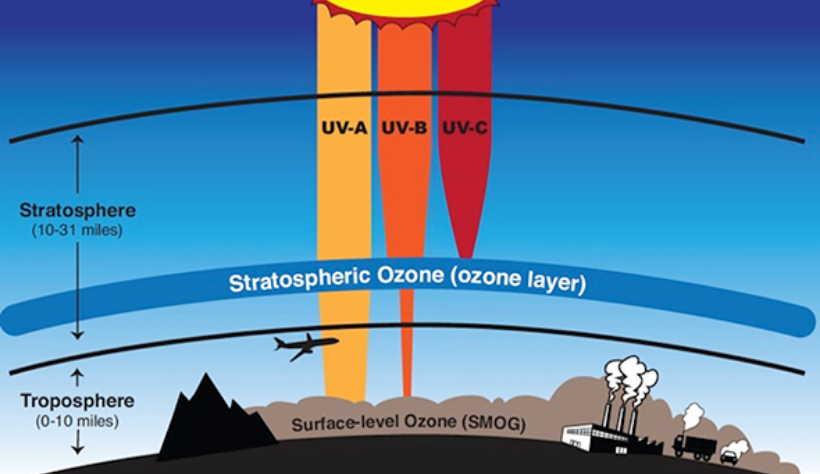
Ozone Depletion
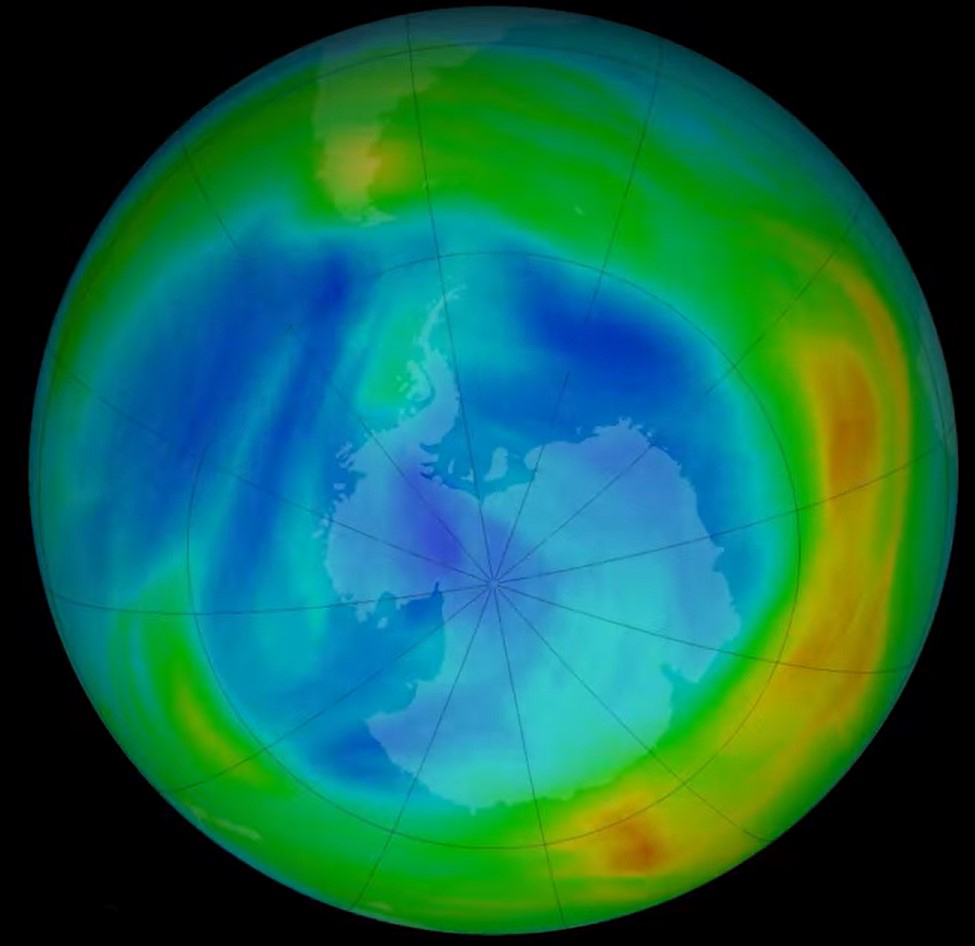
Depending on where ozone resides, it can protect or harm life on Earth. Most ozone resides in the stratosphere (a layer of the atmosphere between 10 and 31 miles above us), where it acts as a shield to protect Earth's surface from the sun's harmful ultraviolet radiation. This portion of ozone is ofter referred to as "good ozone." In the troposphere (the atmospheric layer from the surface up to about 10 miles), ozone is a harmful pollutant that causes damage to lung tissue and plants. This type of ozone is often referred to as "bad ozone". Scientists have found that the "bad" tropospheric ozone is increasing in the air we breathe, and the "good" stratospheric ozone is decreasing in our protective ozone layer.
COMING SOON...
COMING SOON...
COMING SOON...
COMING SOON...
COMING SOON...
Prevention & Mitigation
Reduce Greenhouse Gas Emissions
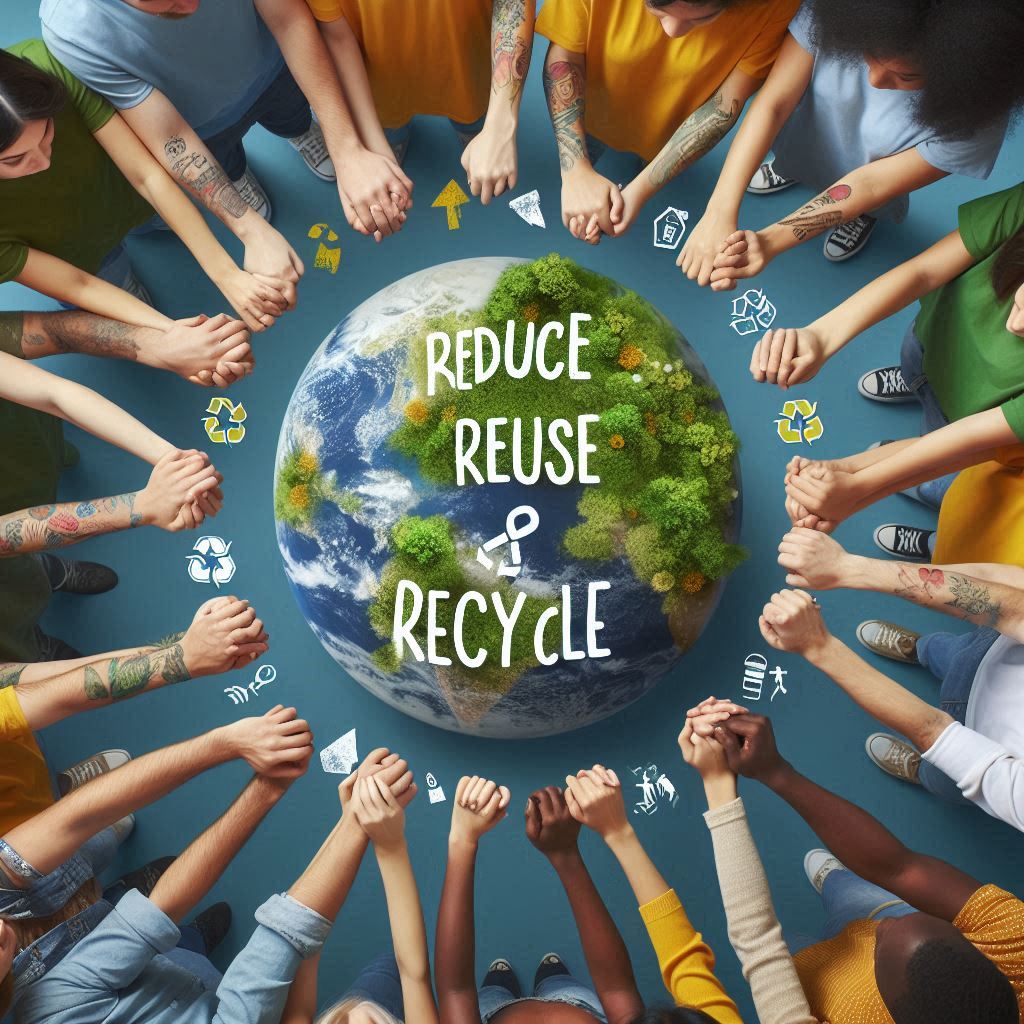
Reduce, Reuse and Recycle
Support Reforestation and Afforestation
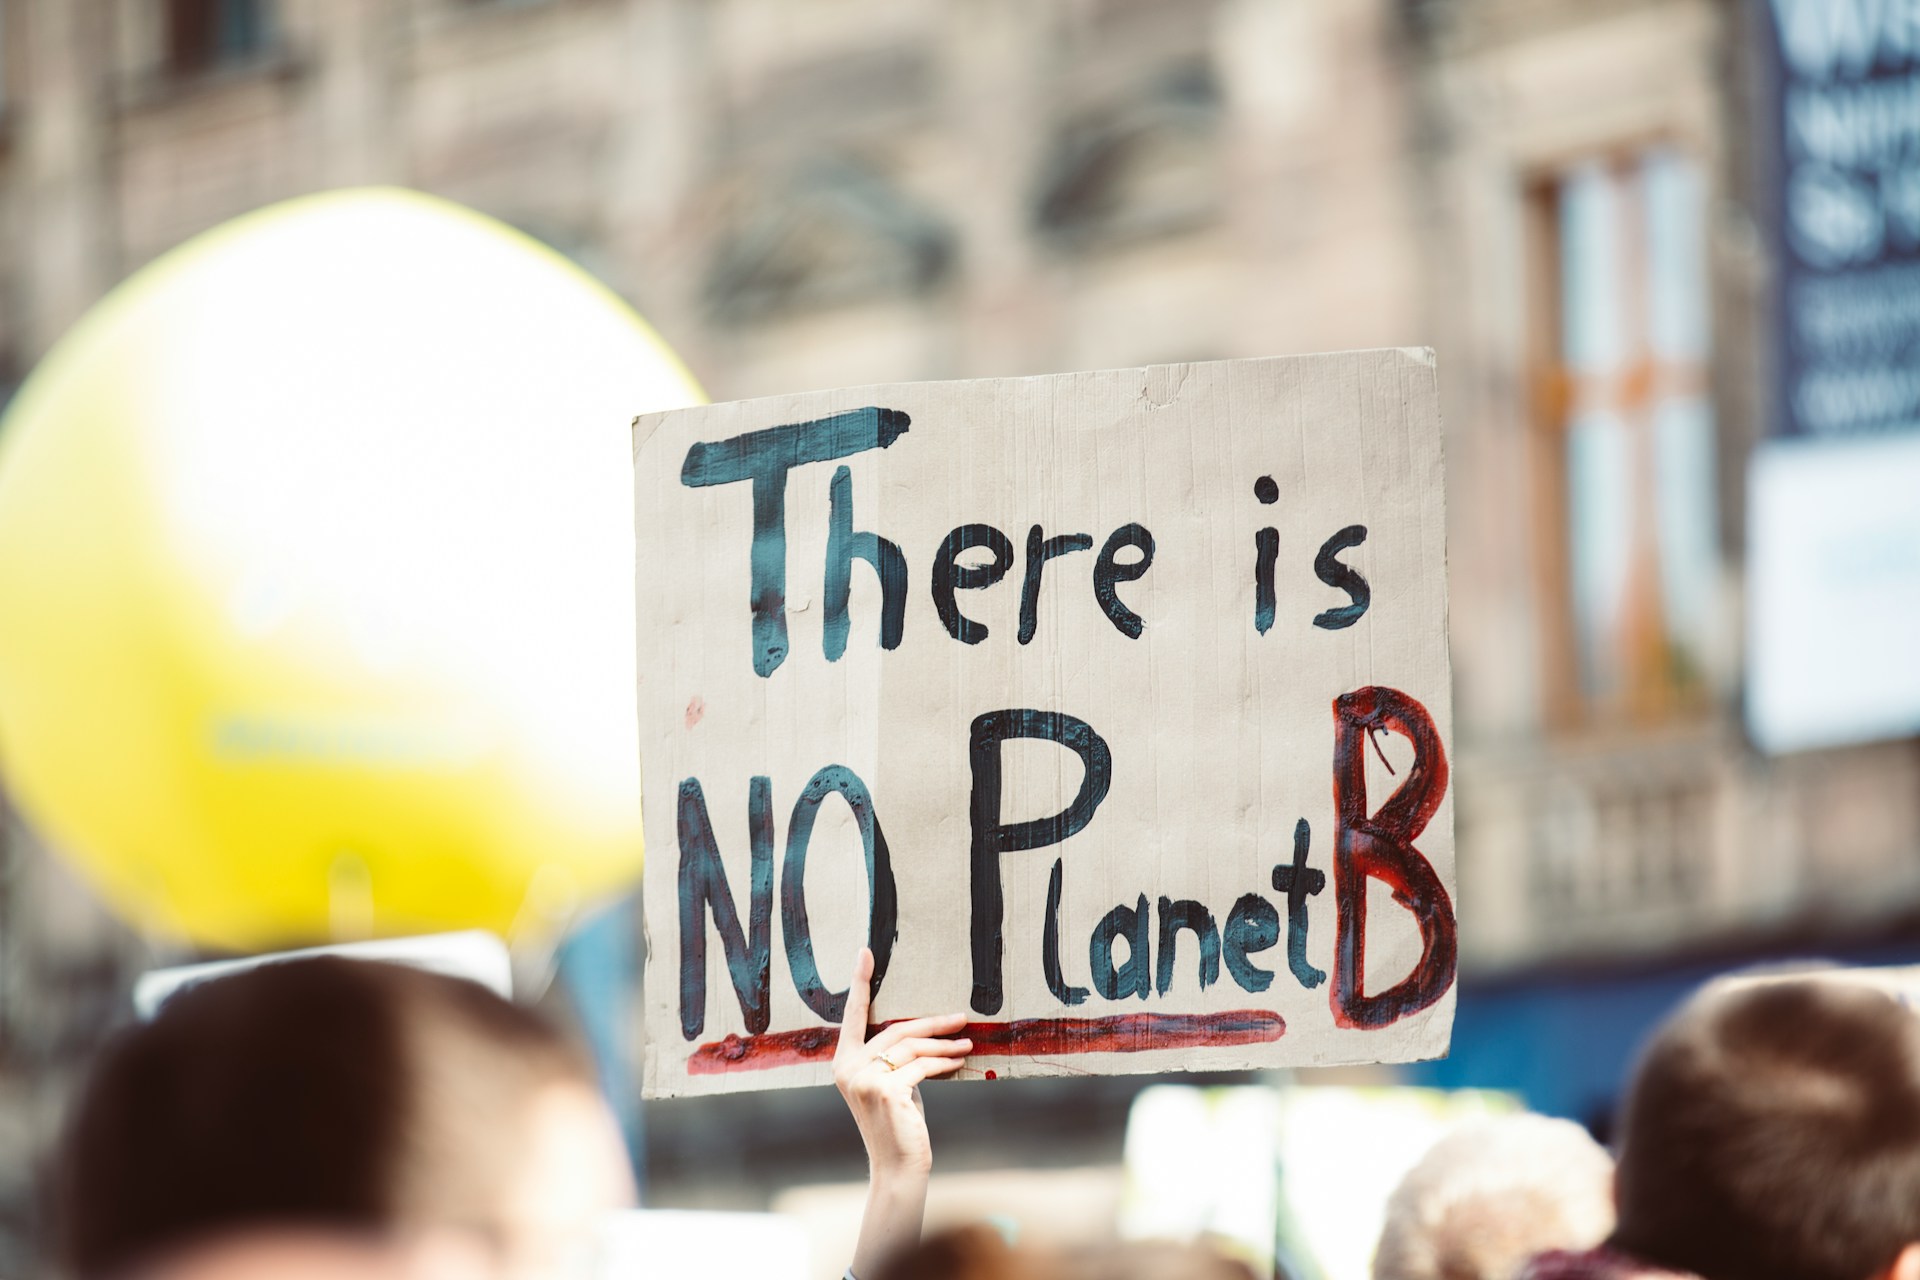
Create Awareness
Live Updates
Global Warming
Global warming is the long-term heating of Earth’s surface observed since the pre-industrial period (between 1850 and 1900) due to human activities, primarily fossil fuel burning, which increases heat-trapping greenhouse gas levels in Earth’s atmosphere. This term is not interchangeable with the term "climate change."
https://science.nasa.gov/climate-change/what-is-climate-change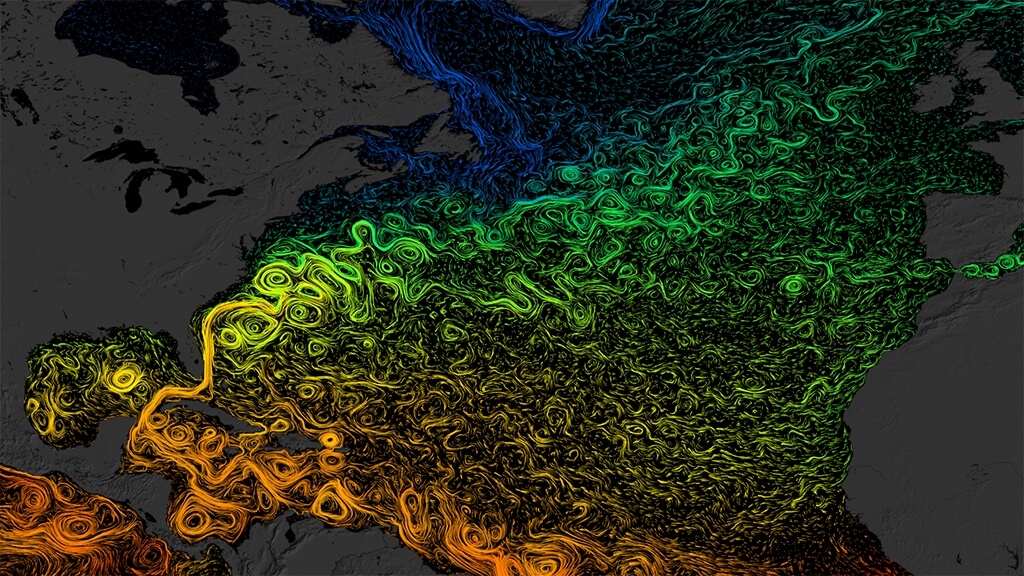
The Ocean Is Getting Warmer
The ocean has absorbed much of this increased heat, with the top 100 meters (about 328 feet) of ocean showing warming of 0.67 degrees Fahrenheit (0.33 degrees Celsius) since 1969.6 Earth stores 90% of the extra energy in the ocean.Covering more than 70% of Earth’s surface, our global ocean has a very high heat capacity. It has absorbed 90% of the warming that has occurred in recent decades due to increasing greenhouse gases
https://science.nasa.gov/climate-change/faq/is-the-ocean-continuing-to-warm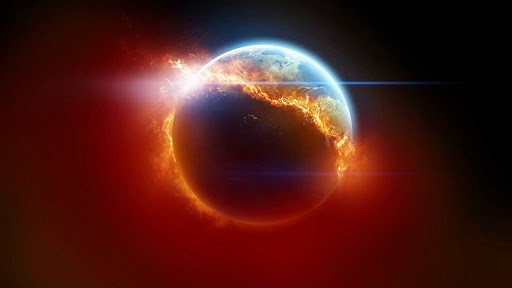
Quiz
1. Who was the first person to travel in Space?
COMING SOON...
Bioscope
Our Planet, Our Home
NASA | Massive Black Hole
Rocket Launch
NASA celebrated the 44th anniversary of Earth Day with a variety of live and online activities April 21-27 to engage the public in the agency's mission to better understand and protect our home planet.
With Earth Day coming up on April 22, the Global Precipitation Measurement (GPM) mission team is hosting a free webinar to describe how and why NASA missions—and the data from these missions—can help us better understand and protect our home planet's climate and ecosystems.
Source:
https://www.earthdata.nasa.gov/learn/webinars-and-tutorials
NASA's Earth Observing System Data and Information System (EOSDIS) is a key core capability in NASA’s Earth Science Data Systems Program. It provides end-to-end capabilities for managing various sources – satellites, aircraft, field measurements, and various other programs.
An upbeat invitation to "Take AIM at Climate Change" - with "AIM" standing for Adapt, Innovate, Mitigate. The lyrics are based on the latest science of Earth's changing climate, with the music a mix of rap and pop.
Source:
https://www.nasa.gov/stem-content/take-aim-at-climate-change-music-video/
Discover what NASA’s Earth data sounds like when it’s turned into music. With each passing Earth Day, the drums get louder. Every sound and instrument tell a story.
Source: https://youtu.be/UU-wmSEPiqw
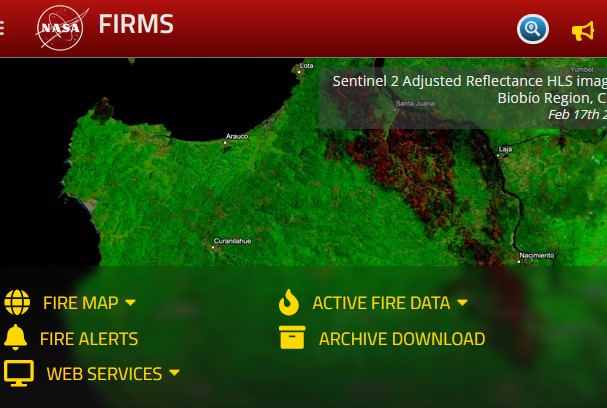
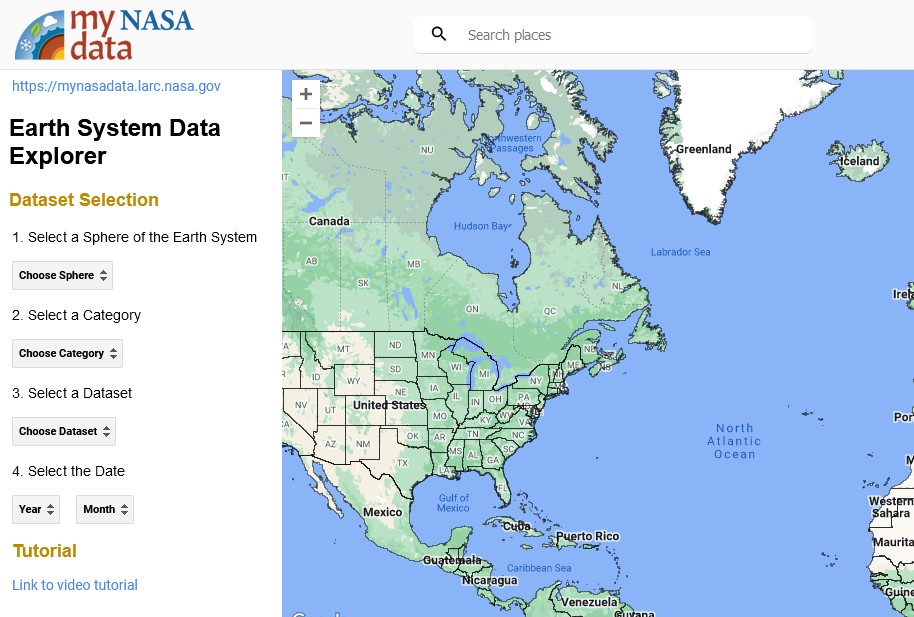
NASA's Resources
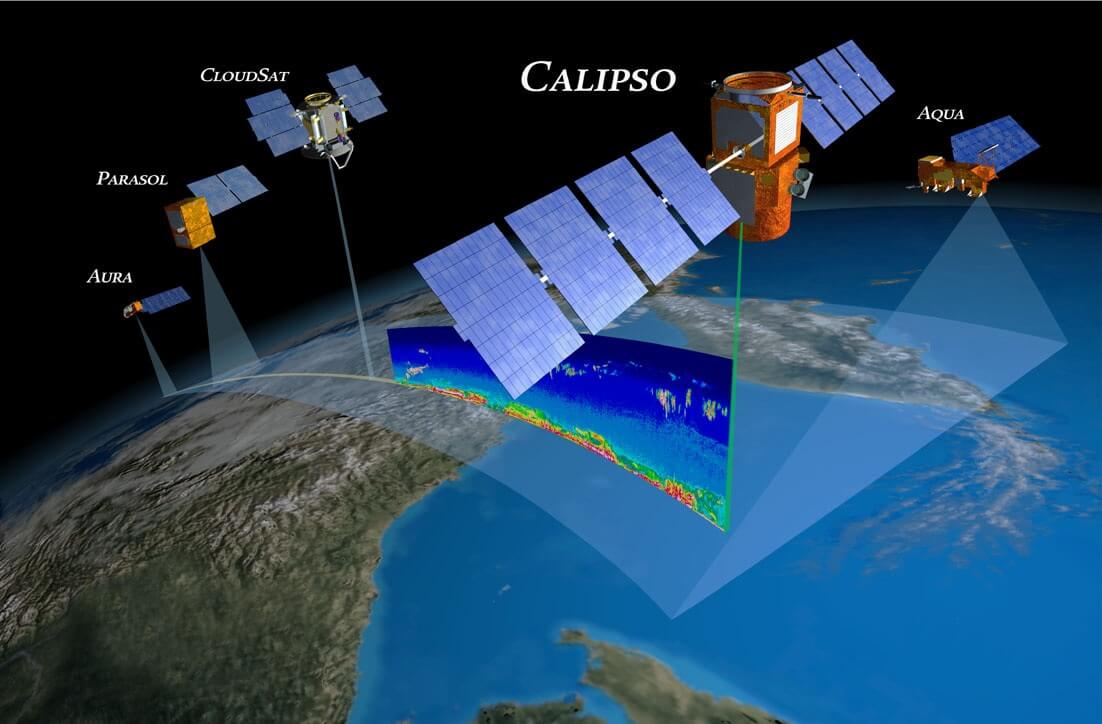
Satellites & Missions
NASA satellites observe Earth’s land, air, water & ice

NASA's Activities
Eyes on Aquarius The joint U.S./Argentinian Aquarius/Satélite de...